Gold price action has barely moved this Tuesday. Yesterday’s 0.79% gain allows the bulls to recoup most of Friday’s losses that occurred following NFP-induced USD strength. On Friday, the unexpectedly strong Non-Farm Payrolls report showing wage inflation and a higher-than-expected print of non-agriculture public sector jobs in the US led to a surge in long-term bond yields and additional bets for more aggressive rate hikes by the Fed.
Both factors drove investment flows away from the non-yielding yellow metal. Gold price has since recovered, as the markets are predicting that July’s core and headline consumer price indices July have cooled. Heading into tomorrow’s report, the market expectation is for a monthly decline of 2 percentage points in the core CPI and a drop of 1.3% to 0.2% in the monthly headline number.
If this plays out according to the consensus, this would be a USD-negative situation, leading to a potential charge towards the 1800 price mark. On the other hand, red-hot inflation figures that beat estimates would put the XAU/USD in a vulnerable position as the data would further strengthen the position of the Fed to be more aggressive with its tightening policy.
Gold Price Forecast
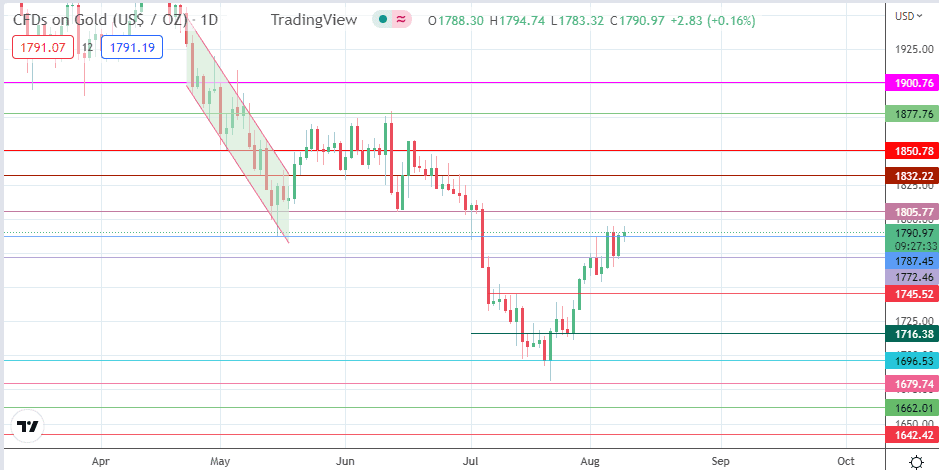
The 1805 resistance mark (14 June and 4 July lows) is the price to beat for the bulls, following yesterday’s violation of the resistance at 1787. A break of this level gives the bulls access to the 1832 price level (20 May low and 29 June high), with 1820 (13 June low) serving as a potential pitstop. Above this level, additional upside targets exist at 1850 and 1877, where the 13 June high is found.
On the flip side, a breakdown of the 1787 former resistance-turned-support (16 May and 1 July low) gives the bears access to 1772 initially, being the site of the 6 July high and 8 August low. Additional price deterioration brings in new targets at 1760 (1 August low) and 1745 (11 July high). 1716 (15 July and 25 July low) and 1696 (20 July low) form additional price barriers to the south.
XAU/USD Daily Chart