Gold price has had a difficult 2022 even as consumer and producer inflation surged to the highest level in over 40 years. XAU/USD has crashed by more than 20% from its highest level in 2022 and is now sitting close to its lowest point since June 2020. Other precious metals like silver, platinum, and palladium have also dropped sharply recently.
Is gold still an inflation hedge?
Gold is a beloved metal for several reasons. The most important one is the fact that it has always been seen as a good hedge against inflation. Proponents of this thesis point to its long-term performance. Its price has surged from less than $30 in the 1970s to over $1,500 today.
However, this view has come under scrutiny in 2022 since inflation has gone out of control in the United States and other countries. Data published last week showed that US inflation remained at an elevated level in September even after the Fed unveiled its most aggressive policy stand.
As such, it is a bit weird that the so-called inflation hedge has underperformed in a period of robust inflation. Gold is not alone. Bitcoin, which some people claim to be digital gold, has crashed by over 60% this year. Interestingly, Treasury Inflation-Protected Securities (TIPS) have also underperformed the market. For example, the iShares TIPS ETF has crashed by 13% this year.
Therefore, what has emerged is that gold price has a close correlation with American stocks and an inverse one with the US dollar index. As gold price collapsed this year, the US dollar index surged to the highest level in more than 20 years.
Therefore, XAU/USD price will react mildly to the latest housing data from the US scheduled for this week. These numbers are expected to show that existing, new, and pending home sales pulled back in September as interest rates continued rising. As such, a situation where the US dollar index continues rising cannot be ruled out.
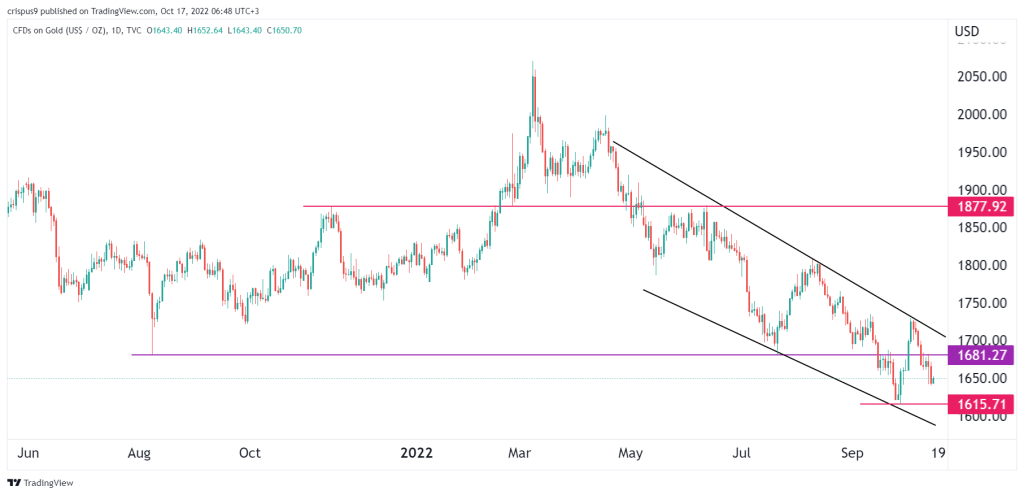
Gold price forecast
The daily chart shows that gold formed a head and shoulders pattern whose neckline was at $1,877. In price action analysis, this pattern is usually a bearish sign. Gold has continued falling and is below all moving averages. Also, it has managed to move below the important support level at $1,681, which was the lowest level on August 9 of this year.
Therefore, the bearish trend will likely continue as sellers target the next key point at $1,615, which was the lowest point on September 29. A move above the resistance point at $1,681 will invalidate the bearish view. Check out and subscribe to InvestingCube’s S&R indicator for an up-to-date gold price forecast.