Gold price has been one of the top winners of 2022 as it jumped from last year’s low of $1,620 to a high of $1,950 or ~20%. This recovery has been driven by the rising optimism of a Fed pivot, supply chain challenges in the sector, and the fact that central bank purchases have risen to a multi-decade high. The rebound has also been in line with a resurgence in stocks and cryptocurrencies. So, does this recovery still have more room to run?
Gold price daily chart analysis
The main catalyst for the XAU/USD price will be the upcoming Fed decision and American jobs data. With inflation easing and the economic growth slowing, economists believe that the Fed will hike by 0.25% and point to a pause in May this year. A hawkish Fed will be bearish for gold and other asset prices.
And on Friday, the US is scheduled to publish its January jobs numbers. The data will provide a broad view of the state of the labor market as companies like PayPal, Goldman Sachs, and 3M announce mass layoffs.
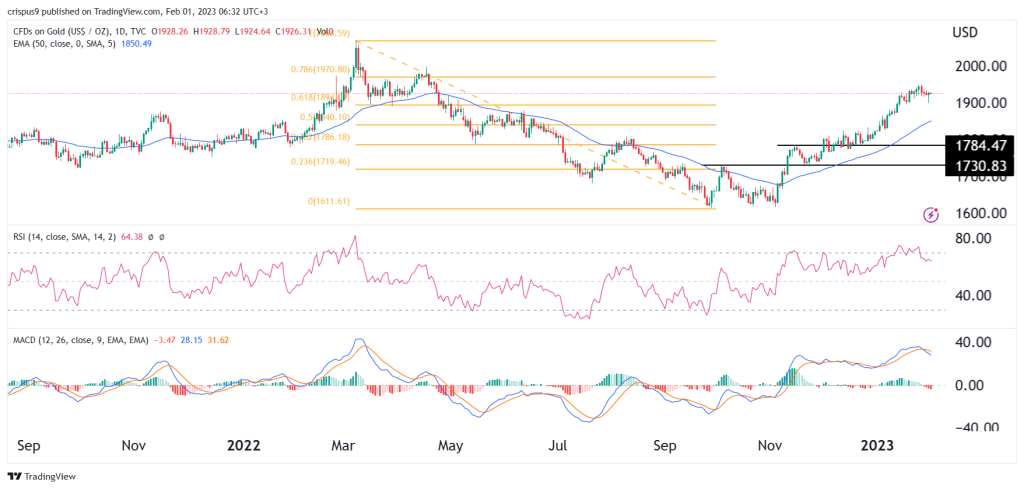
On the daily chart, we see that gold price has been in a spectacular rally in the past few weeks. This recovery has seen it move above important resistance points like $1,730 (October 5 high) and $1,785 (Nov 15 high). Further, gold has moved above the 61.8% Fibonacci Retracement level and is now approaching the 78.6% point at $1,973.
Most importantly, the rally is being supported by the volume-weighted moving average (VWMA). In trend-following, buyers always feel comfortable when the price is above these MAs. However, the Relative Strength Index (RSI) has started pulling back from the overbought level. Similarly, the two lines and the histogram of the MACD have made a bearing crossover.
This price action signals that gold price could have a brief pullback after the FOMC decision on Wednesday. If this view is correct, the next reference level to watch will be at the 50% retracement point at $1,840, which is about 4.45% below the present level.
On the flip side, a volume-weighted move above the year-to-date high of $1,951 will signal that there are still more buyers in the market. Such a move will see gold price rise to above $2,000.
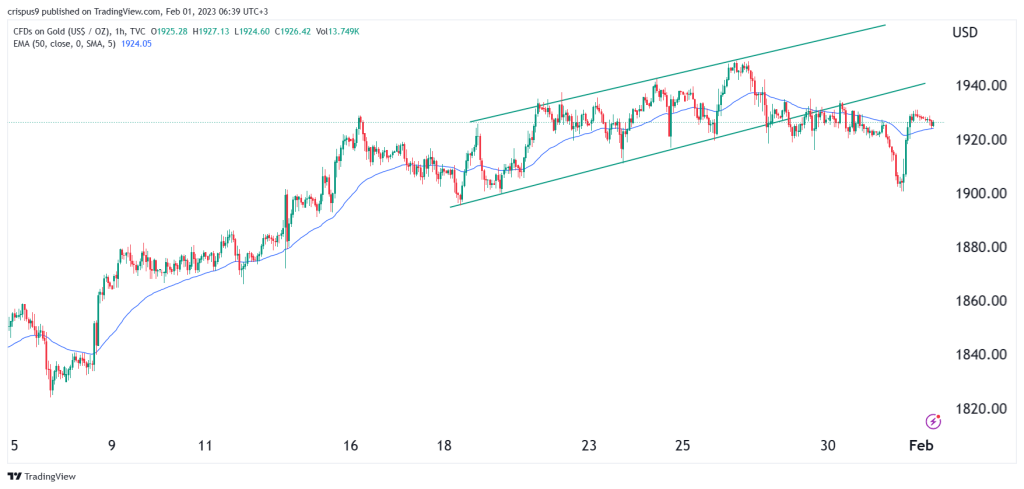
XAU/USD hourly analysis
Conducting a multi-timeframe analysis can help identify key support and resistance levels in a chart. The chart shows that the XAU/USD price was in a bullish trend in January. And as it rose, it managed to form an ascending channel. It recently moved below the lower side of the channel and is now attempting to retest it.
A break and retest pattern is usually a sign of a trend continuation. Therefore, the trend on the 1H chart is bearish until it makes a clear rebound above the lower side of the channel at $1,940.
As such, we can’t rule out a situation where gold price crashes below this week’s low of $1,900. A drop below that point will send a signal that there are still some bearish traders left in the market who will be keen to push it much lower in February. These losses, will likely be temporary as long as the price is above the moving averages on the daily chart.