Gold price action is seeing the second day in the red, as the impact of the weak Chinese economic data early Monday morning and the associated risk-off sentiment continues to favor flows into the safe-haven US Dollar. The greenback is a yielding asset and is seeing more demand than gold, another safe-haven asset that bears no yields.
The XAU/USD asset fell 1.28% on Monday after China recorded a drop in industrial production, retail sales, and fixed asset investments. However, gold price is seeing a more muted downside move this Tuesday and is down 0.18% as of writing. This is due to the impact of lower long-term bond yields, which is seen capping the strength of the greenback.
The fundamental bucket for the week that will impact gold price comes first from the FOMC minutes, which are due for release on Wednesday at 1400 hours EST. But before then, the US Retail Sales data will hit the newswires at 0830 hours EST. Traders will look closely at the FOMC minutes to see what the thinking of the Fed will be heading into its September rate decision.
Gold Price Forecast
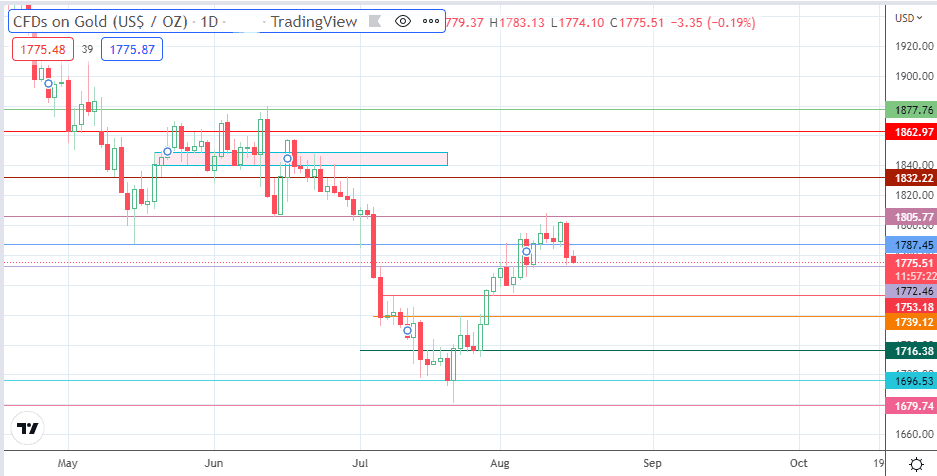
The active daily candle is testing the support at 1772 (6 July high, 8 August low). The bears need to push for a breakdown of this support. If this is successful, 1753 becomes the next downside target, being the site of the high of 8 July and the low of 29 July. The 22/27 July highs at 1739 form an additional target to the south.
Further price deterioration brings the 1716 price mark (15 July high/25 July low) into the picture as other southbound targets. This outlook is negated if the bulls force a bounce off the 1772 support. This would favor an approach toward 1787 (16 May low and 2 August high) as the initial upside price milestone before 1805 (14 June low and 10 August high), becomes a new target if the advance takes out 1787.
Additional targets to the north include 1832 (20 May low and 24/29 June highs) and 1862, the site of the previous high of 27 May. However, a supply zone between 1839 (27 June low) and 1849 (20 May high and 20 May low) could form a pitstop before 1862 becomes a viable target.
XAU/USD: Daily Chart