
Gold price (XAUUSD) is up slightly today as traders reflect on the sharp decline that happened today. Gold is up by 0.35% and is trading at $1,935, which is a bit higher than yesterday’s low of $1,921. At the same time, silver and copper are up by 0.22% and 1.12% respectively.
Gold rises ahead of NFP data
Gold price has risen today ahead of the important nonfarm payroll numbers that will come out at 12:30 GMT. Analysts polled by Reuters expect the data to show that the economy created more than 1.4 million jobs in August. That will be a smaller number than the 1.7 million that were created in the previous month. Still, the economy has more than 10 million more jobs to add to go back to pre-pandemic levels.
Better than expected jobs numbers could put gold price under pressure. That is because these numbers will add to the positive numbers that have recently come out. For example, the number of people filing for unemployment benefits has started to fall. Also, the manufacturing and services PMIs were relatively strong in August. Therefore, impressive numbers could lead to a stronger dollar, which is usually a negative thing for the price of gold.
El-Erian warns of another 10% decline in stocks
Gold price is also rising as investors react to a statement by Mohammed El-Erian on the state of the market. In an interview with CNBC yesterday, the respected economist who serves as the chief economist at Allianz said that he believes that stocks could fall by another 10%. Although gold fell yesterday when stocks declined, it tends to perform well when the stock market is weak. He said:
“We could have another 10% fall, easily … if people start thinking fundamentals. If the mindset changes from technicals to fundamentals then this market has further to go, but it remains to be seen whether it will change.”
Gold price technical outlook
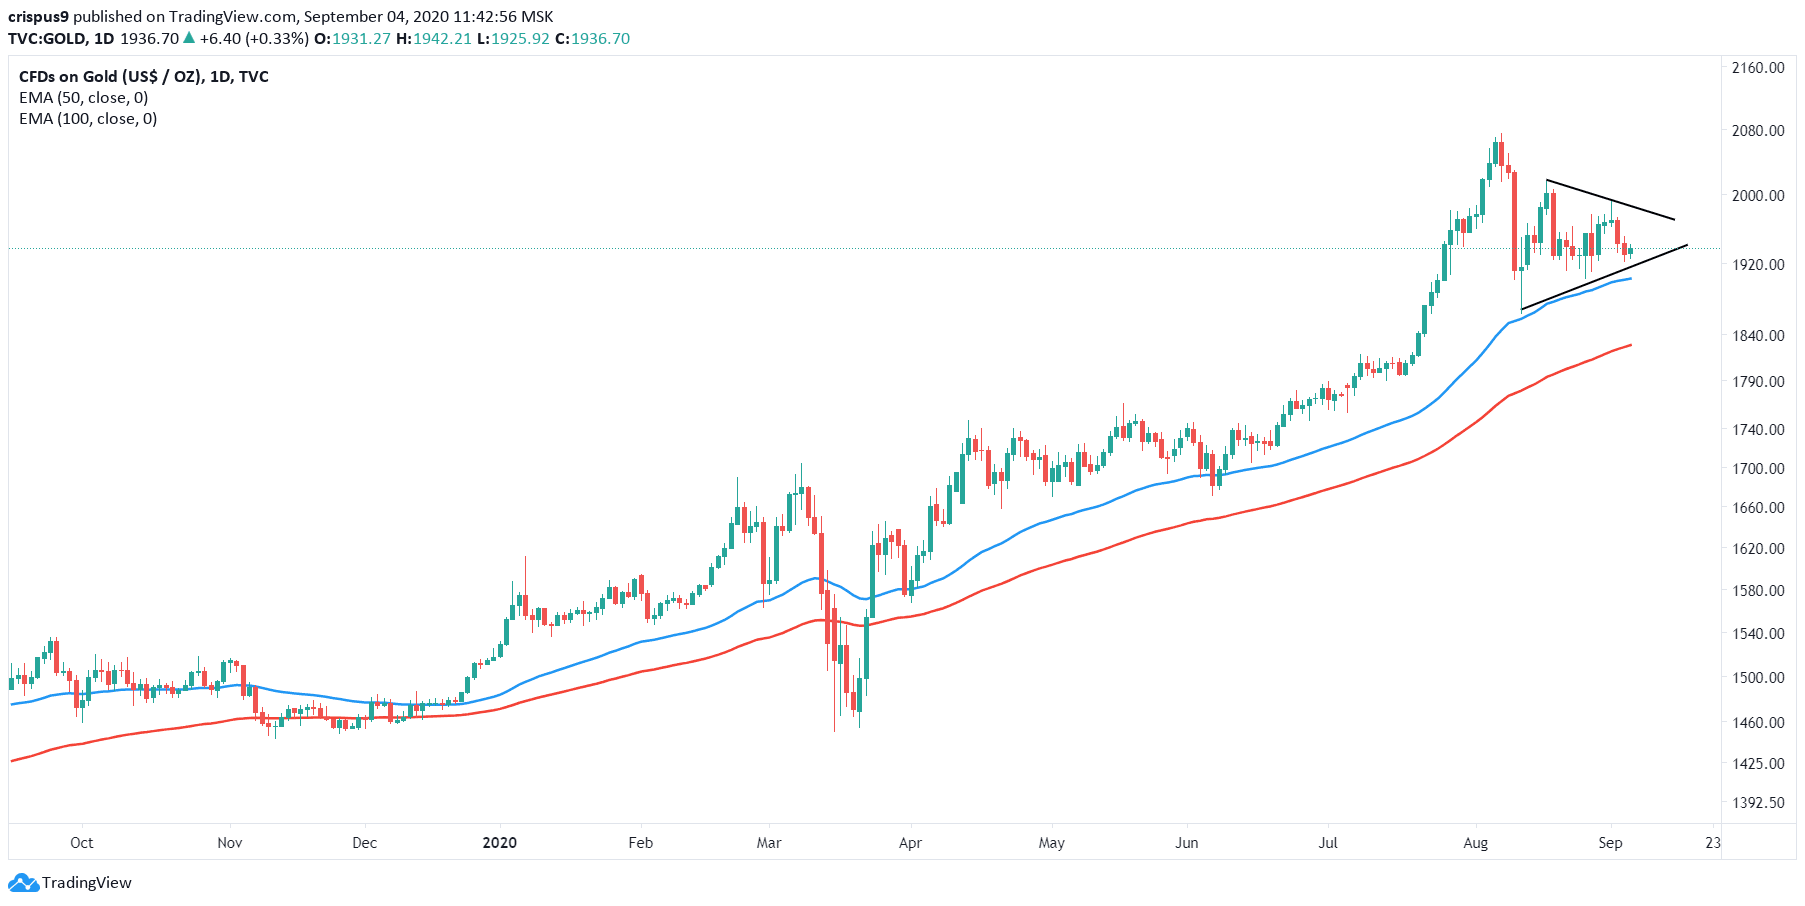
The daily chart shows that gold price has been moving in a sideways direction in the past few days. The price is trading at $1,935, which is slightly higher than its lowest price yesterday. The chart also shows that the price is forming a symmetrical triangle pattern that is shown in black. It is also above the 50-day and 100-day exponential moving averages.
Therefore, I suspect that the price will remain within this range ahead of the nonfarm payroll numbers. If the numbers come better than expected, there is a possibility that the price will drop, potentially below the lower side of the triangle at $1,920.
Don’t miss a beat! Follow us on Telegram and Twitter.
Gold Price Technical Chart
More content
- Download our latest quarterly market outlook for our longer-term trade ideas.
- Follow Crispus on Twitter.
- Do you enjoy reading our updates? Become a member today and access all restricted content. It is free to join.