Gold price is attracting bids the last two hours and is approaching the critical $1,446 resistance. Gold is getting a hand after President Trump yesterday announced an additional 10% tariffs on the remaining USD300 billion worth of US imports from China, starting September 1st. Investors turn to safe heaven assets such as Yen and gold.
The low for the day is at $1,430.27 and the high at $1,448.71. The main trend is still bullish and now the short term momentum also shifted to the upside. In the mid-term, gold prices are trading sideways between $1381, and the year-to-date high at $1452.90.
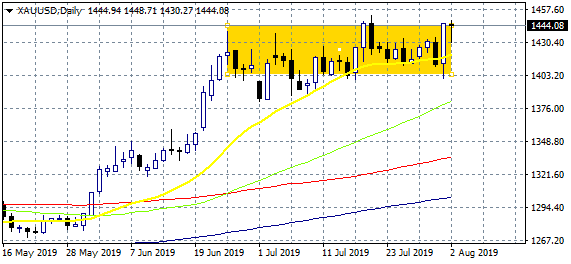
Gold price has created a rectangle since mid June which considered a continuation pattern. The price is moving sideways between 1,405 and 1,448 all these days and is looking for a break above that can lead to a move higher up to 40 dollars at 1,488.
Immediate support for the yellow metal stands at $1,420 the 20 day moving average (yellow line), then at $1,400 and $1,382, the 50 day moving average. On the upside resistance would be met at 1,448 the today’s high and then at 1,452 yearly high.
Bulls are controlling the game as long as the price holds above 1,400. A break below will question the positive momentum, but I will wait for a break below 1,390 to start any short positions. The rectangle that has sketched is a continuation pattern meaning that gold is taking a short breath before it will continue higher. If the rectangle at 1,405 area failed to stop the price then I will open a short position. A buy signal for me will occur If gold moves above 1,448 mark.Don’t miss a beat! Follow us on Twitter.