
Any further bullish Green Metaverse Token price predictions may need to pause at this time if the picture on the daily chart plays out as expected. The active daily candle shows that the day’s trading has been characterized by whipsaws and choppiness, evolving into a doji candle. Given that the token has registered three straight days of solid bullishness, a pause in price action seems to be the next logical step. But what is the Green Metaverse Token (GMT), and why has it commanded such strong interest when the rest of the market is floundering?
GMT latest news
My opinion is that 2022 is the year of the Metaverse tokens. The interest will resurface, and the prospects for recovery are high. Never mind that some better-known “metaverse” tokens like SAND, GALA and MBOX are more than 50% off their all-time highs. The strong demand for GMT, which has taken it from $0.01 to a high of $0.45 (a 4,400% increase), is an affirmation that there will be resurgent demand for the Metaverse tokens.
The Green Metaverse Token is the governance token of STEPN. STEPN is a Solana-based Web3 lifestyle blockchain Socialfi and Gamefi network. It presents rewards to users who can earn by doing outdoor sports within the metaverse. GMT is presently offering an airdrop of its tokens worth $50,000. The first 2,000 users to complete various social media tasks will share this amount. Users are expected to join the Discord channel, enter their retweet links, their Binance Smart Chain addresses, and follow the team on Twitter and Telegram to qualify for the airdrop.
GMT Price Prediction
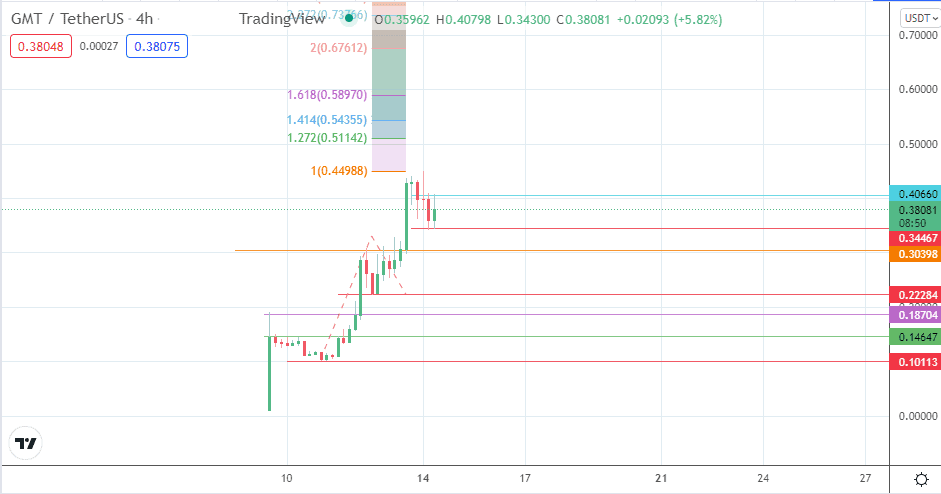
If the active daily candle ends as a doji, the chances of a correction are heightened. The 4-hour chart reveals a measure of retreat from the all-time high following the doji and the bearish 1900UTC candle of 13 March.
The intraday drop of 14 March found support at the 0.34467 price mark. The resulting bounce met resistance at 0.40660, where the previous candle’s high is located. Resumption of the correction follows rejection and a pullback from this point. Suppose the 0.34467 support breaks down. The correction depends and targets 0.30398 initially. A further slide brings in 0.22284 into the mix.
On the flip side, a further advance on the GMT/USDT pair requires a breach of the resistance at 0.40660. This breach would open the door to retest the current all-time high at 0.4500. If this mark is surpassed, there is potential for 0.51142 (127.2% Fibonacci extension) and 0.54355 (141.1% Fibonacci extension level) to become additional targets to the north.
GMT/USDT: 4-Hour Chart
Follow Eno on Twitter.