During the 2020 summer months, the GBPUSD pair outperformed most of its peers. It even outperformed the EURUSD, despite the later stealing the headlines for most of July and August. The proof comes from the EURGBP cross that actually declined during the two months, revealing the stronger trending conditions on the GBPUSD pair.
The rally from during the coronavirus pandemic was/still is mostly fueled by a weak USD. The Fed reacted aggressively and the fiscal stimulus in the United States outpaced the one in the United Kingdom. Moreover, the demand for dollars declined significantly since April when the Fed opened the USD-denominated swap lines with major central banks in the world, BOE included. As a matter of fact, the swap lines are still open to this day.
Savings Rate in the United Kingdom Keeps Rising
Despite central banks and governments injecting liquidity into the financial system, households are still reluctant to spend. According to the money and credit report released by the Bank of England, in July this year, both households and businesses strongly increased their sterling money holdings.
A higher savings rate dents economic recovery and shows the uncertainty ahead. As such, the only thing that makes a difference when trading a currency pair like the GBPUSD is the monetary and fiscal policy. To this point, it favors the British Pound, as easing in the United States surpassed the one in the United Kingdom.
GBPUSD Technical Analysis
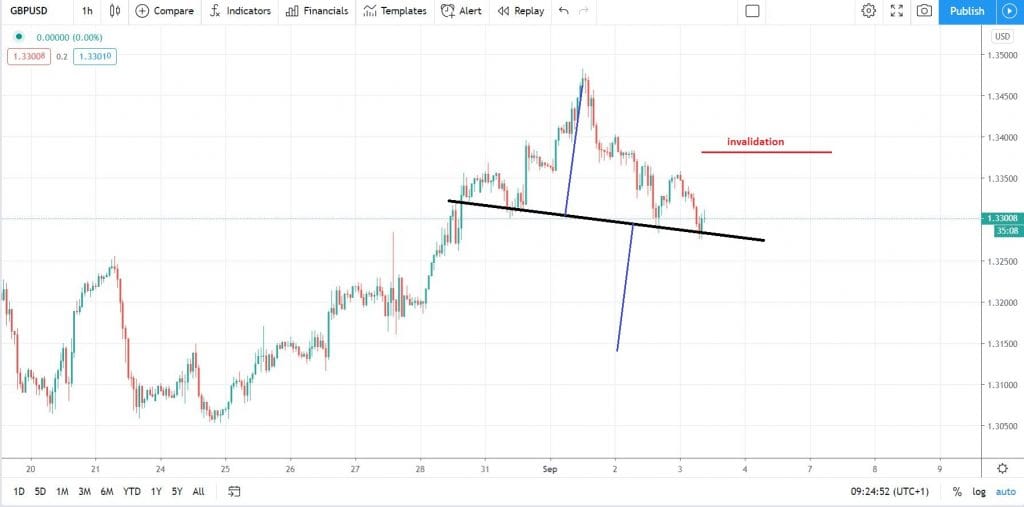
The GBPUSD forms a head and shoulders pattern on the hourly chart. While not much of a reversal due to the lower timeframe, it still offers a decent risk-reward ratio.
Looking to short the pair on a consistent break of the neckline with the stop on the invalidation area and a target below the measured move. Or, if a bounce comes first, sell from the invalidation point, place a stop loss at the highest point in the pattern and target the measured move for an even better risk-reward ratio.
For more about trading classic technical analysis patterns, consider our Forex trading course.
Don’t miss a beat! Follow us on Telegram and Twitter.
GBPUSD Price Forecast
More content
- Download our latest quarterly market outlook for our longer-term trade ideas.
- Follow Mircea on Twitter.
- Do you enjoy reading our updates? Become a member today and access all restricted content. It is free to join.


