The GBP/USD price tumbled to the lowest level since December 2020 as investors reflected on the latest American inflation and UK GDP data. The GBPUSD is trading at 1.3405, which was the lowest level since December 23rd. The pair has dropped by about 6% from the YTD high.
UK GDP and US inflation data
The UK economy grew at a relatively slower pace in the third quarter. According to the Office of National Statistics (ONS), the country’s economy expanded by just 1.3% in Q3, which was substantially lower than the second quarter’s growth of 5.5%. On a year-on-year basis, the economy expanded by about 6.6% as the Delta variant spread.
Other important numbers publshed by the ONS were also relatively weak. For example, the trade deficit widened to more than 14.75 billion pounds while the construction, manufacturing, and industrial production declined in September.
Therefore, the GBP/USD crashed since these numbers differ from those of the American economy. On Wednesday, data by the government showed that the headline consumer inflation data rose to a 30-year high of about 6.2%. Core inflation rose to 4.6%.
GBP/USD forecast
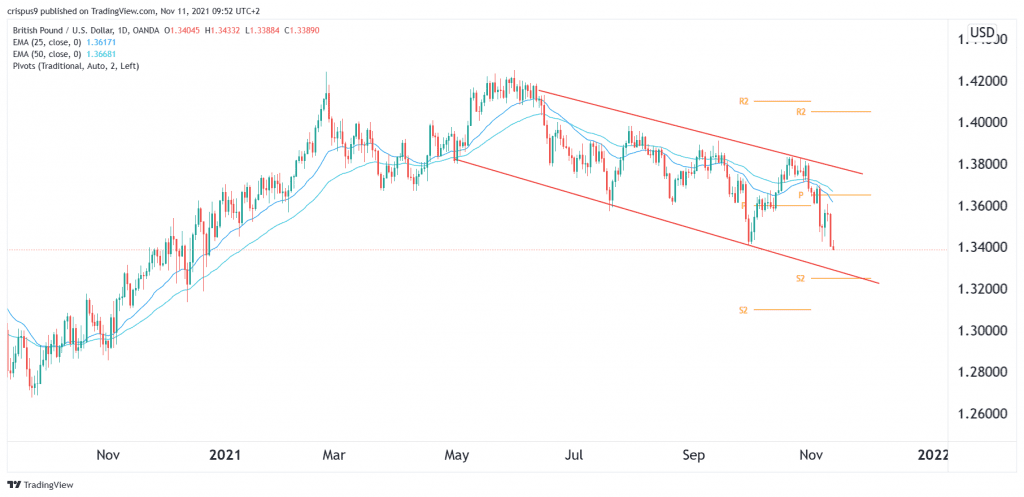
On the daily chart, we see that the GBP/USD pair has been in a deep sell-off in the past few months. Along the way, the pair has formed a descending channel that is shown in red. It is currently slightly above the lower side of this channel. Also, the pair has moved below the 25-day and 50-day moving averages.
Therefore, the pair will likely keep falling as bears target the second support at about 1.3260. This price is also along the lower side of the descending channel.