The GBP/USD’s collapse was predicted on this site two weeks back in one of my articles. The Bank of England’s gloomy outlook and the potential for inflation to rise above the BoE’s projections combined to make the GBP’s outlook the most bearish it has been in decades.
Analysts at Citi say UK inflation could soar above 18% in January, further denting consumer spending and taking food, energy and housing expenses out of the reach of most Britons. CBI Industrial Order Expectations fell steeply, from 8 to -7.
The consensus was for a drop to 2. A marginal increase in business activity in the services sector was obliterated by the steep fall in the Flash Manufacturing Index data. The index measuring the business activity in the UK’s manufacturing sector fell from 52.1 to 46.0 (versus 51.0 consensus).
This was the weakest data set for this metric in 18 months and signals a significant slowing of business activity in the UK manufacturing sector. Investment bank JP Morgan is now predicting that the GBP/USD may fall to 1.14, taking the pair below the low of March 2020, which at the time was the site of 35-year lows.
GBP/USD Forecast
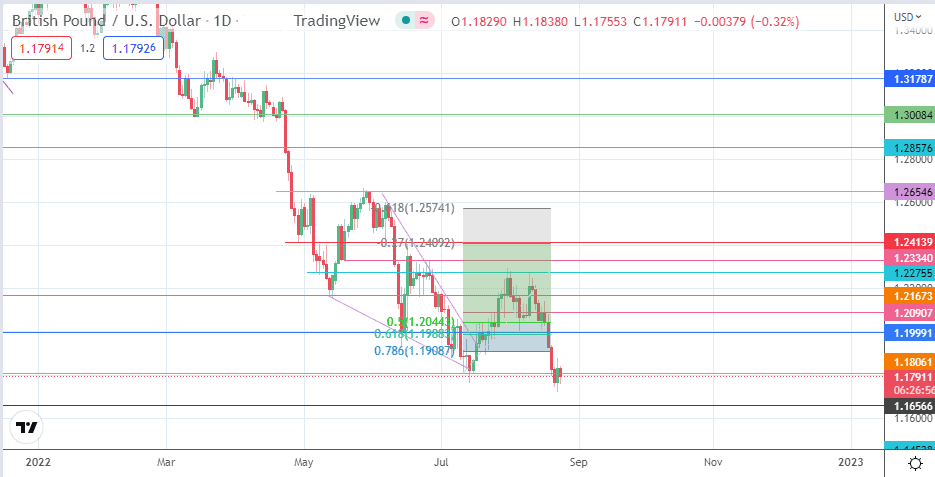
The neckline’s breakdown at 1.19991 completes the 1 August and 11 August double top pattern, clearing the way for a measured move that targeted completion at the 1.18061 support. The 20 August candle violated this 12 July and 19 August low, but the bulls managed to hold out.
This level needs a downside breach for the price action to continue south. The 20 March 2020 all-time low at 1.14098 becomes a realizable target if the bears can take out the 1.16566 price support (25 March 2020 low) and the 18 March 2020 low at 1.14538.
This outlook is negated if the bulls force a bounce from the 1.18061 support. This retracement bounce targets 1.19991 initially, with a potential pitstop forming at the 78.6% Fibonacci retracement from the swing low of 11 July to the swing high of 2 August. 1.19087 is the price mark of note here. The recovery continues if the former neckline at 1.19991 gives way. This leaves 1.20907 and 1.21673 (1 July and 5 August highs) as potential upside targets.
GBP/USD Daily Chart