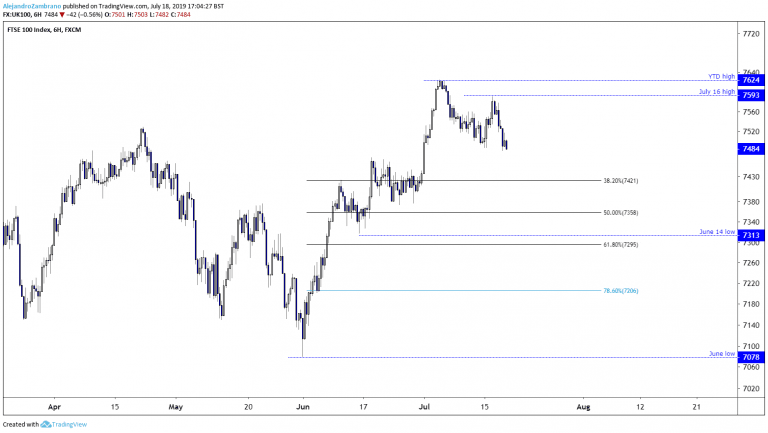
The short-term trend in the FTSE 100 has turned bearish, and the price would probably need to overcome the July 16 high of 7593 to resume its short-term bullish trend.
The longer-term trend is bullish since the start of 2019, and we can derive potential support levels using the Fibonacci retracement tool from the June low of 7078 to the year-to-date high of 7626. I use the June low as the start of the fibonacci calculations as it is the latest major low and as long as the price trades above this level the multi-month trend will remain upwards.
The first three major Fibonacci level come in at 7424, followed by 7361, and 7297. What is interesting is that starting from the first Fibonacci level to the third one, the price spent consolidating from June 11 to 28, and the most important support level in this consolidation cluster is the June 14 low at 7313. The combination of natural support in the proximity of the 7313 low, and the Fibonacci levels suggests that the next bull-leg in the markets could start in between 7298 and 7421 interval. However, a definite breach to 7295 will probably send the price towards the 78.60% retracement level at 7206. I suspect the next steps for speculators will be to see how the price reacts in the above mentioned fibonacci range, and possibly start to build a bullish of the FTSE 100 shows signs of stabilizing. Don’t miss a beat! Follow us on Twitter.
Download our latest quarterly market outlook for our longer-term trade ideas.
Do you enjoy reading our updates? Become a member today and access all restricted content. It is free to join.