The FTSE 100 index has delivered a Santa rally this year. The index has risen in the past three straight days and is hovering near its highest level this year. It is trading at £7,380, which is slightly below the YTD high of £7,400. It has risen by more than 5.90% from the lowest level in November.
There are several reasons why the FTSE index has done well recently. First, fears of the Omicron variant have eased slightly in the past few days. Reports from the UK, US, and South Africa have confirmed that the Omicron variant has mild symptoms than the previous variants. As such, there is a likelihood that companies in the FTSE 100 index will not see a major disruption of business.
Second, the UK government has announced that it will not implement major lockdowns in the coming days. Earlier this week, UK health officials were putting pressure on the government to impose more lockdowns as the number of Omicron cases jumped.
Third, analysts believe that UK stocks are relatively undervalued compared to their American peers. The FTSE 100 index has an average PE of about 13, which is lower than the S&P 500 average of more than 29. This explains why the number of deals to acquire UK companies has been on an upward trend. Therefore, there is a likelihood that the consolidation will continue in 2022.
FTSE 100 index forecast
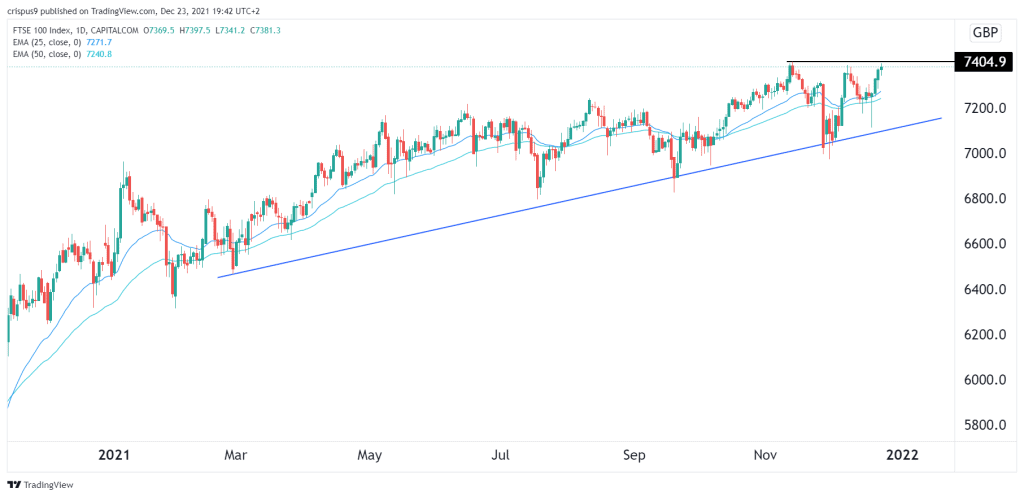
The daily chart shows that the FTSE index has been in a strong bullish trend in the past few weeks. The index is trading slightly below the key resistance level at £7,404, which was the year-to-date high. It is also being supported by the 25-day and 50-day moving averages. The index is also slightly above the ascending trendline that is shown in blue.
Still, while these are bullish factors, there is a key concern. The index seems to be forming a double-top pattern. In price action analysis, this pattern is usually a bearish sign. Therefore, the index must first move above the key resistance at £7,404 for the bullish breakout to be confirmed.