

- The USD/INR has inched higher at the start of the new week, nearing two-month lows as oil prices hit $88 per barrel on the Brent benchmark.
Current Setup and Live Chart
The balance of risks for the USD/INR as we head into the new week currently favors the greenback, as the rupee nears two-month lows. Treasury yields remain resiliently higher amid strong US economic sentiment. This is despite the cooling of inflation in June. Markets have paid little attention to last week’s Consumer and Producer Price Indices, as they reflected the inflationary scenario while the US-Iran truce lasted. The renewal of hostilities last week is expected to reinforce inflationary expectations for July, which is why the markets are pricing in this scenario against the CPI and PPI data releases for August.
Furthermore, geopolitical uncertainty continues, reinforcing safe-haven demand for the greenback, even as rising crude oil prices pile pressure on the Indian rupee. Oil prices inched higher at the start of the week, rising to $88 per barrel at the start of the New York session this Monday.
India’s exposure to higher energy prices, due to its status as the third-largest net crude importer, continues to put the rupee end of the USD/INR pairing on the defensive. The current market sentiment prices in a higher energy risk premium and rising demand for US dollars from Indian refiners. As before, the Reserve Bank of India (RBI) continues to use various measures to smooth excessive volatility and prevent outsized moves, even as USD/INR inches higher.
USD/INR Macro Drivers
1) Higher Oil Prices
Oil prices are gradually inching towards the $90 mark, which poses a remarkable challenge for the import-dependent Indian economy and the rupee by extension. Higher oil prices raise the crude oil import bill, create additional demand for the US Dollar (to pay for the product, which is priced in US Dollars on the international market), and also put additional current account pressure on the Indian economy. Higher energy prices also produce imported inflation, since virtually every industry runs on fossil fuels that are derived from crude oil. Higher oil prices automatically increase the price of energy derivatives on which these sectors run. Higher oil prices remain the strongest macro driver of the USD/INR.
2) Strong US Dollar Sentiment
Safe-haven demand for the US Dollar, as markets shift from capital appreciation to capital preservation, as well as the risk of imported inflationary pressures, keeps sentiment for the US Dollar strong. The situation drives US Treasury yields higher in anticipation of a more hawkish Fed policy to keep inflation under check. US economic data point to a resilient economy. As long as the sentiment on the US Dollar remains strong and higher energy prices weaken sentiment on the rupee, the USD/INR will stay supported.
3) RBI Intervention
The rupee’s value is also determined not just by forces of demand and supply, but by the policy measures of the Reserve Bank of India under the managed float system. The RBI continues to maintain and deploy a substantial foreign exchange reserve arsenal to defend the rupee to prevent any outsized moves. The RBI is reported to have used $100 billion in its interventionist moves over the course of the first phase of the US-Iran war. Policy actions include sales of US Dollars to handle rising demand, liquidity management, and forward market operations. These measures are meant to prevent disorderly market moves, but do not produce price reversals. Any retracements are usually dip-buying opportunities as long as the current situation persists.
Price Catalysts for the USD/INR
1) US Economic data and Treasury yields: The USD/INR’s direction is directly proportional to the direction of US Treasury yields and US economic data. Higher bond yields and stronger-than-expected US economic data will lead to a higher push on the USD/INR due to a reinforcement of US Dollar demand and capital flows into USD-denominated assets.
2) Brent crude prices: Oil price direction is also directly proportional to the USD/INR’s direction, as higher prices tend to cause a weakening of the rupee. Brent crude’s price remains the primary external price catalyst for the Indian rupee.
3) Foreign portfolio investment: The Indian stock and bond markets host a large percentage of their holdings from foreign portfolio investments. Whenever there are capital inflows, these must be converted from foreign currency such as USD into the local currency for deployment into the Indian markets. When there are net outflows, the investments must be liquidated and reconverted into foreign currency for exit into other destinations. A risk-off scenario driven by higher oil prices causes net capital outflows (rupee-negative). In comparison, net capital inflows that typically occur when the market is risk-on (lower oil prices) are rupee-supportive.
USD/INR Forecast Scenarios
Base case: the bias favors a bullish pairing, as higher oil prices, safe-haven demand and stronger sentiment around the US economy and the US Dollar continue to provide structural support for the pair.
Bull case: if oil prices approach $100 a barrel (or higher), this will drive US bond yields higher and create a more risk-averse market situation. This will accelerate dollar demand and rupee weakness as India will have to battle with a much higher USD demand and a higher import bill. We will also see net capital outflows from foreign portfolio funds. In this scenario, USD/INR could mount a fresh challenge to hit new highs.
Bear case: if there is a geopolitical de-escalation, the oil risk premium dissipates. Lower oil prices mean that the risk of imported inflation is reduced. India will have a reprieve from its import bill status, and a risk-on market means foreign portfolio funds will re-enter Indian markets, all of which improve sentiment on the rupee and allow the USD/INR to retrace towards recent lows in a pullback move.
USD/INR Technical Outlook
The price has bounced off the 95.24 support after the 10 July pinbar candle pullback was rejected by the bulls off that support line. This unlocked the current advance move that is well on its way to reclaim the 96.99 all-time high, which now serves as the next resistance.
A break of this resistance puts the pair on the path to the 27% Fibonacci extension of the 8 April – 20 May upswing at 98.32 as the next upside barrier. 99.87 is the 61.8% Fibonacci extension and comes into the picture if the bulls uncap 98.23.

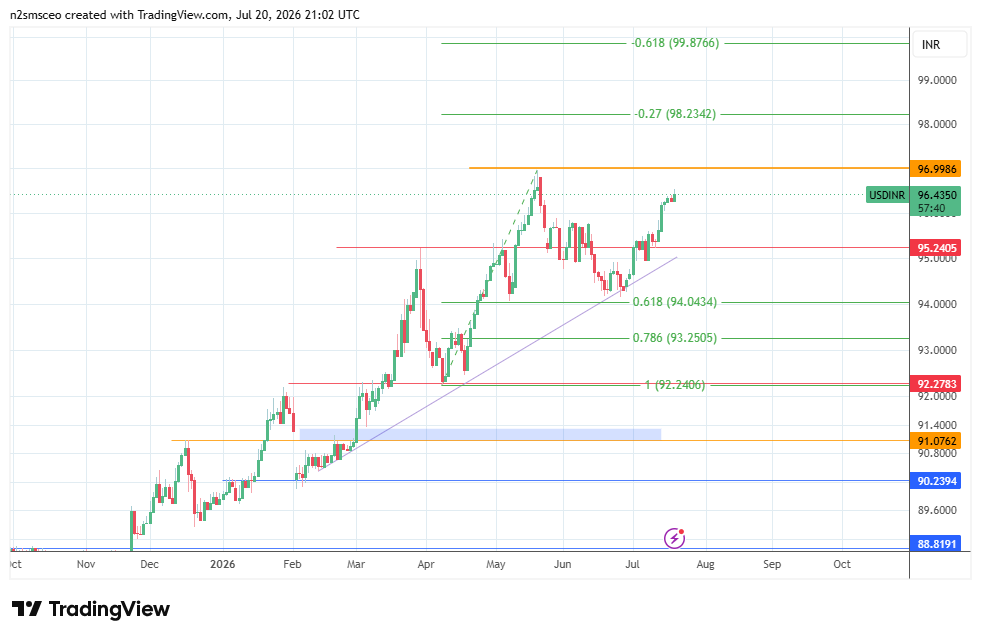
Conversely, a weakening of the current advance and subsequent breakdown of the 96.99 support allows for a retracement towards the 95.24 support level and site of the 10 July low. Below this, additional support is seen at 94.04, the site of the 7 May low and the 18 June/25 June double bottom pattern. This move is dependent on the bears taking out the dynamic support provided by the ascending trendline that has connected the price dips since 19 December 2025.