

- Broad weakness on the USD after the dismal US Non-Farm Payrolls print for July 2026, with the lowest labor participation in 5 years.
The U.S. Non-Farm Payroll Report for July has been released. According to the report released by the U.S. Bureau of Labor Statistics, Non-farm Employment Change (ex.Agriculture)came in at -23k, with the prior number being downgraded from 57k to 20K. These figures are far lower than the 85K projected by polled economists. Furthermore, the U.S. unemployment rate fell from 4.2% to 4.1%, mostly due to a reduction in labor participation. Average hourly earnings month-on-month came in at 0.1%, lower than local consensus-acquired numbers of 0.3%.
The report is an additional one which serves to confirm the previous private sector employment data released on Monday by the automated data processing company, which also showed that private sector hiring was equally struggling.
The data indicates that labor force participation in the NFP data fell to 61.4%, which is the lowest level in more than 5 years, and accounts for the drop in unemployment rates to 4.1%.
How Selected Assets Responded to the Dismal NFP Print
1) GOLD
The results indicate that the U.S. economy is not as resilient as once thought, which makes a case for the Fed to push back on any proposed rate tightening well into the future. The lowering of U.S. bond yields has followed the release of this result. On the XAUUSD asset, which is the listing of gold on several trading platforms, gold price is up 2.73% on the day, having spiked all the way to 4370 in the minutes following the news release. Even though there has been a slight pullback to 4356 as of writing, gold prices remain decidedly higher on the day.
Gold: Technical Outlook
The resistance to beat is the 4382 price barrier, having breached the 4287 resistance and the 78.6% Fibonacci retracement of the 17 June-1 July 2026 downswing. If this barrier is uncapped, the bulls will have clear skies to aim for the late-May 2026 highs at 4584. There is a potential for smaller resistance barriers along the way, the most notable being the 4500 psychological resistance and high of 4 June.

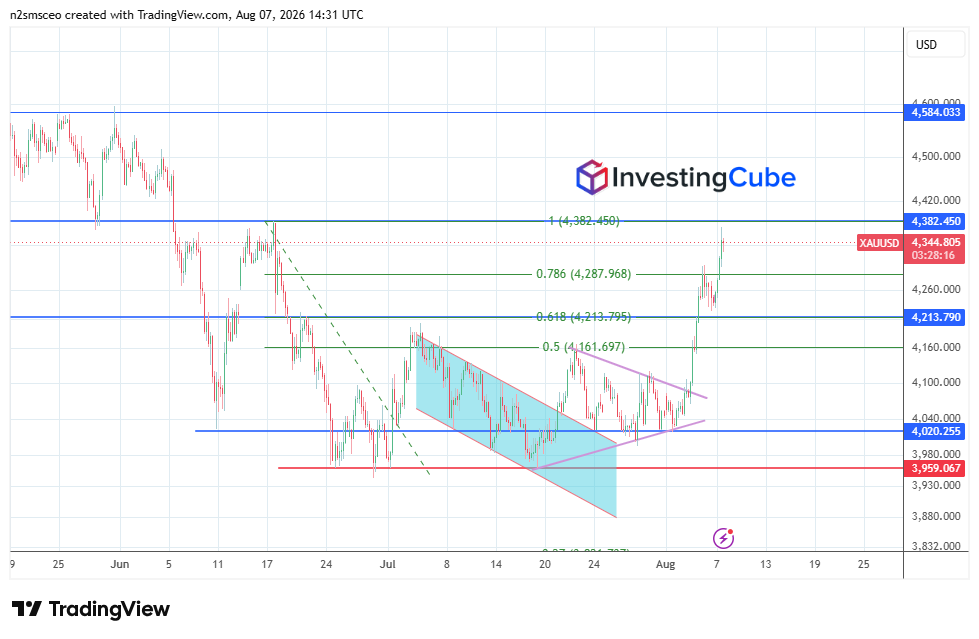
On the other hand, any retracements on the XAU/USD have to follow a breakdown of the 4287 support, targeting the 61.8% Fibonacci retracement level at 4213, followed by the 4161 support and prior high of 22 June, which also serves as the 50% Fibo retracement level.
2) EUR/USD
On the EUR/USD, the move has led to a further uptick on the pair. The EUR/USD is currently trading 0.34% higher as the USD weakened following the dismal US Non-farm Payrolls Report. This puts the euro at 7-week highs versus the greenback. The move has enabled the completion of the double bottom’s measured move, with price touching the 1.1577 resistance at the highest point of the move. This barrier remains under pressure as price continues to aim for further intraday retests.
EUR/USD Technical Outlook
The 1.1577 resistance remains under threat from the bullish move. A break of that resistance and the supply zone ahead unlocks access to the 1.1671 resistance, site of the 28 October/3 December 2025 and 29 May 2026 highs.
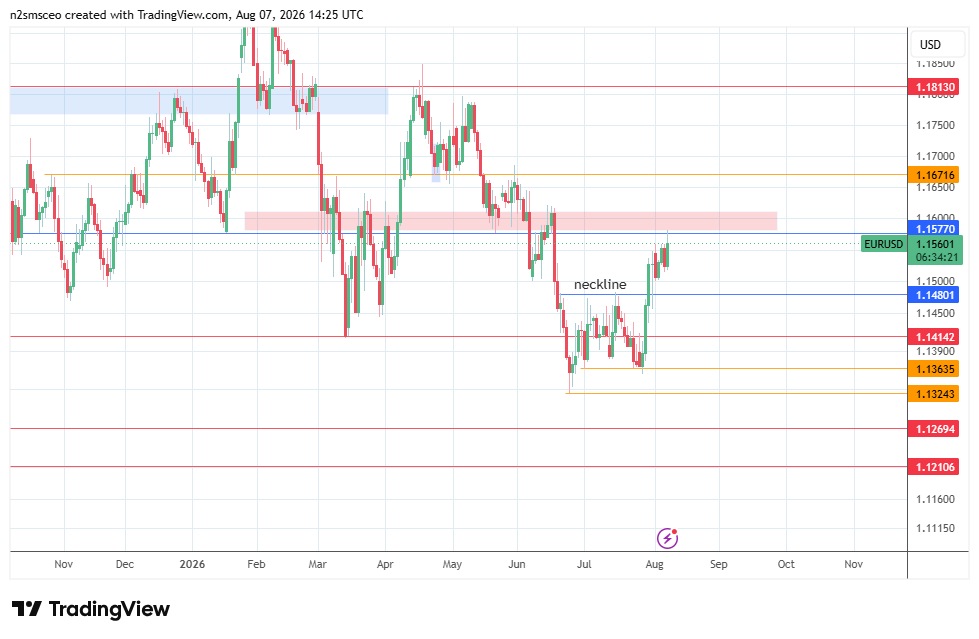
Conversely, a rejection at the current barrier could allow for some profit-taking, inducing a retracement towards the 1.1480 support and neckline of the completed double bottom pattern. Below this level, additional support comes in at 1.1414 (13 March 2026 low) and 1.1363 (28 July 2026 low), in the near term.
3) USD/JPY
As expected, the USD/JPY currency pair fell on the disappointing U.S. employment numbers. The Yen surged following the U.S. jobs data release and is presently 0.53% higher against the USD. The USD/JPY briefly violated the 157.64 support level before bulls stepped in to push prices back as profit-taking ensued. The pair continues to test this support level vigorously, as U.S. bond yields are trading lower on the day. The intra-daily decline further extends the gains made by the Japanese Yen against the U.S. Dollar following last week’s intervention by Japanese and U.S. financial authorities.
USD/JPY Technical Outlook
The 157.64 support remains under pressure. A breakdown of this pivot brings in the 155.51 support level, which is formed by the 61.8% Fibonacci retracement of the 12 February 2026 – 30 April 2026 upswing, and the lows of 30 June – 4 May 2026. Below this level, additional support comes in at 154.50-154.26, the support zone bounded by the 5 December-17 December 2025 lows and the 78.6% Fibonacci retracement level.
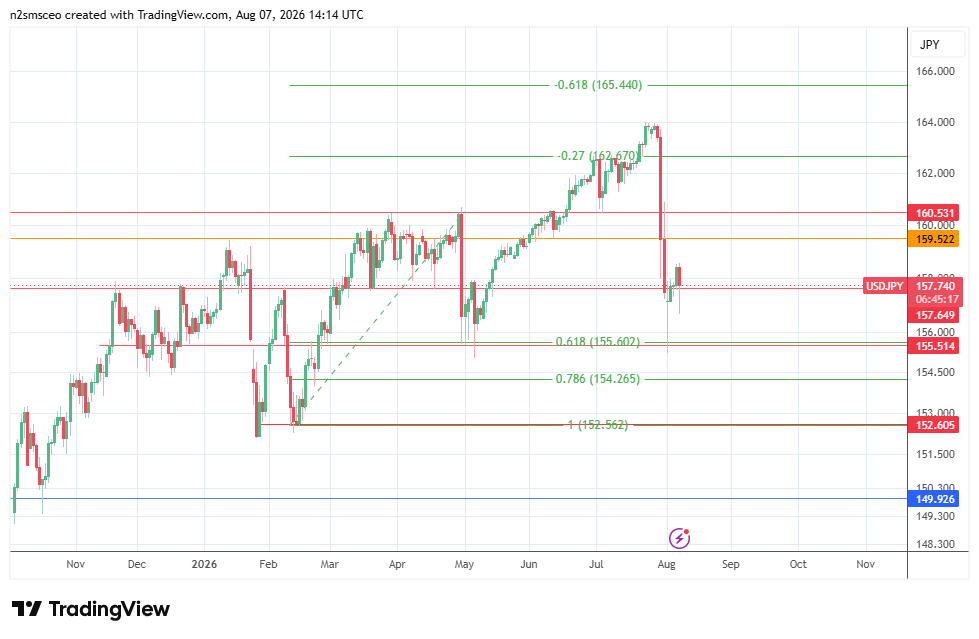
Conversely, a bounce on the current support invalidates the downside move, allowing for a recovery towards the 160.53 resistance formed by the highs of 30 March and 30 April, and the low of 3 July 2026. However, a potential pitstop may arise at the high of 14 January, which paints at 159.52.