

- Brent Crude reclaimed the $110.88 handle as President Trump’s deadline extension failed to soothe markets, leaving the Strait of Hormuz shuttered and fueling a massive "Risk-Off" rotation into the U.S. Dollar.
- Despite rising tensions, Gold suffered a violent -12.8% technical breakdown to $4,457.18, driven by central bank liquidations and a desperate need for dollar liquidity across emerging markets.
- Aussie and Peso Under Siege: High-beta currencies faced a "double whammy" of domestic weakness and global panic, with AUD/USD tumbling toward 0.6888 following dismal PMI and CPI data, while the Mexican Peso buckled under a dovish Banxico shift.
The final full week of March 2026 was defined by a brutal decoupling of traditional safe-haven correlations. While the U.S. Dollar Index (DXY) surged toward the 100.00 psychological milestone, Gold, typically the ultimate hedge, faced aggressive selling pressure as the $111 crude oil shock forced global markets to prioritize cash over bullion.
As President Trump extends his Iran ultimatum to April 6, the effective closure of the world’s most critical energy artery has left traders grappling with a stagflationary outlook that favors the Greenback above all else.
US Dollar (DXY) weekly recap: Safe-haven bid targets 100.00
The US Dollar Index (DXY) maintained its aggressive bullish trajectory as jittery investors fled equities for the Greenback. Regarding price action, the DXY climbed steadily through the week and is currently trading at 99.720. The 4-hour chart shows the index comfortably supported by the 99.682 level, with the MACD confirming sustained bullish momentum heading into the weekend.
DXY key technical levels to watch:
- Support: 99.382 This previous resistance has now fully transitioned into a support floor where buyers are consistently stepping in.
- Invalidation: 98.700 A break below this level would be required to shift the current buy-the-dip safe-haven mentality.
- Resistance: 100.00 This remains the primary psychological ceiling that bulls must clear to confirm a parabolic move.

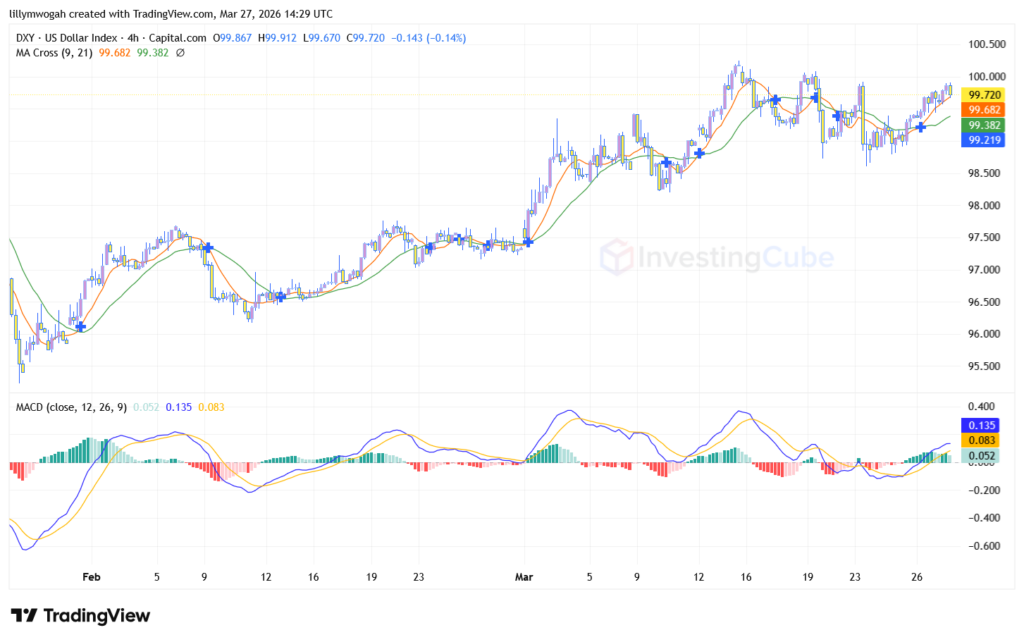
DXY outlook: The path of least resistance remains higher as long as the 99.382 floor holds. With the market pricing in an April 6 deadline for energy strikes, the DXY is likely to attempt a decisive breakout above 100.00 at the Sunday open.
Gold (XAU/USD) weekly recap: Bullion buckles under liquidity stress
Gold delivered the most shocking move of the week, failing to attract safe-haven bids and instead falling victim to massive liquidation. Regarding price action, XAU/USD collapsed from its February highs, breaking below the 4,899.60 support and plummeting to 4,457.18.
The daily chart shows a steep bearish candle that has sliced through both the 9 and 21-day Moving Averages, with the MACD recording its largest negative histogram of the year.
XAU/USD key technical levels to watch:
- Support: 4,375.52 This is the current floor on your chart; a daily close below this could trigger a move toward the 4,000.00 level.
- Invalidation: 4,899.60 Bulls need to reclaim this blue line to suggest the current liquidations have ended.
- Resistance: 5,111.90 This previous support has now flipped into a massive ceiling for any potential relief rallies.
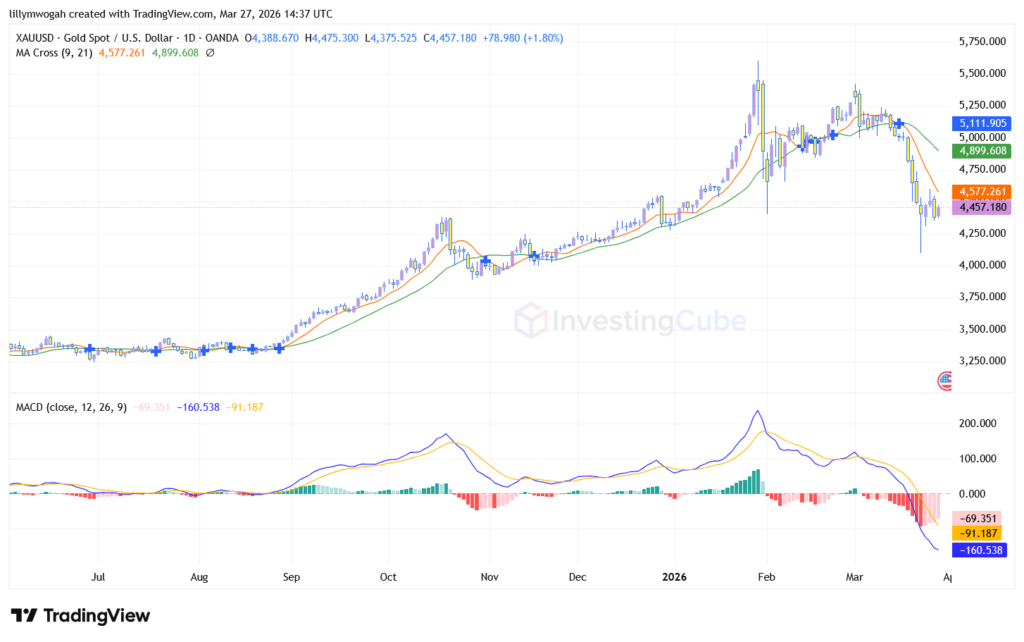
Gold outlook: The short-term bias is aggressively bearish as liquidity remains the market’s primary concern. Unless geopolitical tensions lead to a broad Dollar softening, Gold remains vulnerable to further downside tests of 4,375.52.
USD/JPY weekly recap: The 160.00 standoff and intervention anxiety
USD/JPY remains the most volatile theater in the G10 space. After last week’s “Line in the Sand” rejection, the pair spent this week grinding back toward the brink.
The weekly price action saw USD/JPY test a high of 159.952, effectively tapping the 160.00 handle again before a minor cooling to 159.890.
USD/JPY key technical levels to watch:
- Support: 157.523 This remains the immediate structural floor; a drop here would suggest a temporary win for the BoJ.
- Invalidation: 154.018 The broader bullish trend remains intact as long as the pair holds above this deep support.
- Resistance: 159.95 This is the danger zone where sellers are clustered in anticipation of government action.
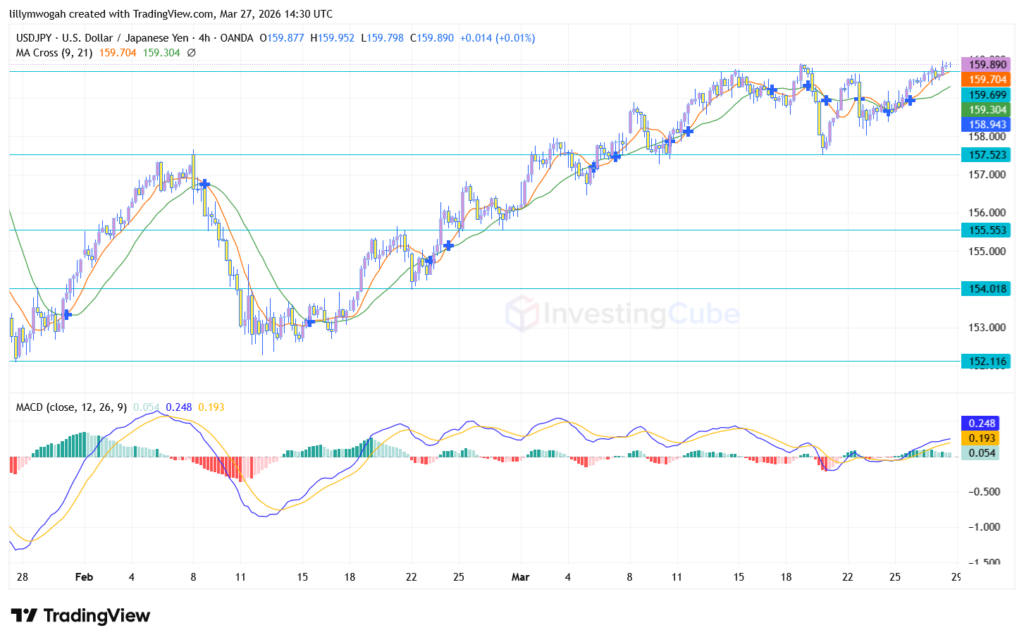
USD/JPY outlook: The pair is stuck in a “policy-tight” range. While the trend is technically up, the intervention risk at 160.00 makes long positions extremely dangerous. Expect sideways-to-volatile movement until a clear BoJ catalyst emerges.
AUD/USD weekly recap: Aussie crushed by CPI and PMI “double whammy”
The Australian Dollar was the week’s biggest victim among the majors.
Price action saw AUD/USD tumble toward the 0.6888 region, a move fueled by Wednesday’s softer-than-expected CPI data and a contractionary Composite PMI of 47.0.
AUD/USD key technical levels to watch:
- Support: 0.6872 This is the current year-to-date low on your chart. A failure here opens the door for a deeper correction.
- Resistance: 0.7070 This previous support has now flipped into a heavy supply zone for any relief rallies.
- Invalidation: 0.6996 Bulls need to reclaim the orange line (9-period MA) to stop the current bleeding.
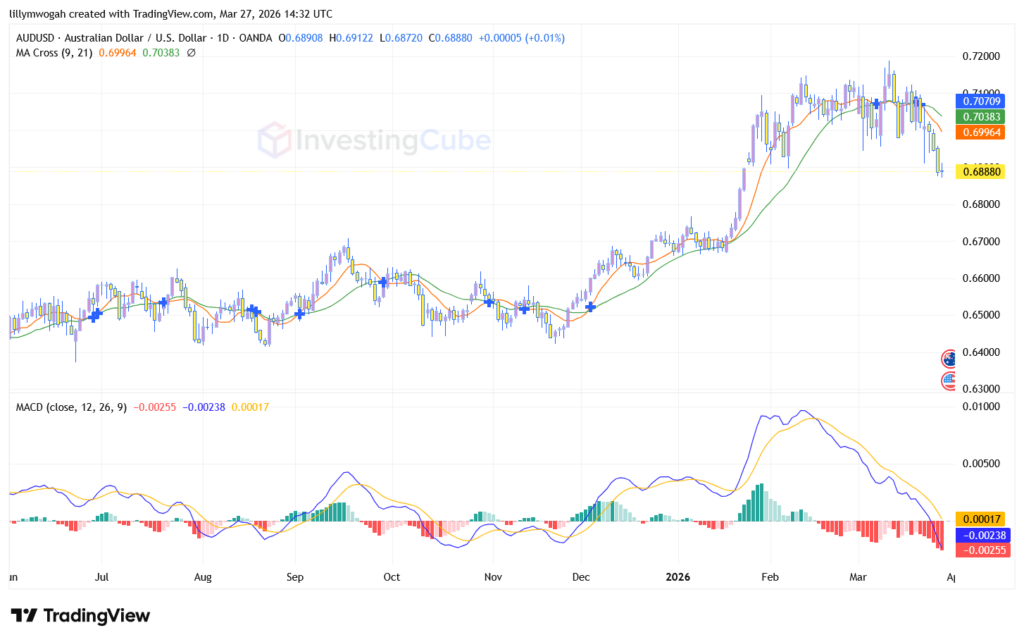
AUD/USD outlook: The fundamental backdrop has shifted bearish. With domestic demand slowing and risk-off sentiment peaking, the Aussie is likely to re-test the 0.6872 floor early next week.
USD/MXN weekly recap: Carry trade unravels on dovish Banxico
The Mexican Peso saw a violent breakout this week as the carry trade began to unwind following Banxico’s dovish pivot.
Regarding price action, USD/MXN surged through the 17.82 moving average resistance to close at 18.043. The Daily chart shows a strong momentum shift with the MACD turning positive for the first time in months.
USD/MXN key technical levels to watch:
- Support: 17.829 This is the immediate floor (orange line) bulls must defend to maintain the breakout.
- Invalidation: 17.270 The long-term bearish trend is invalidated as long as price holds above this February pivot.
- Resistance: 18.103 This is the weekly peak; a break above this targets the next psychological level.
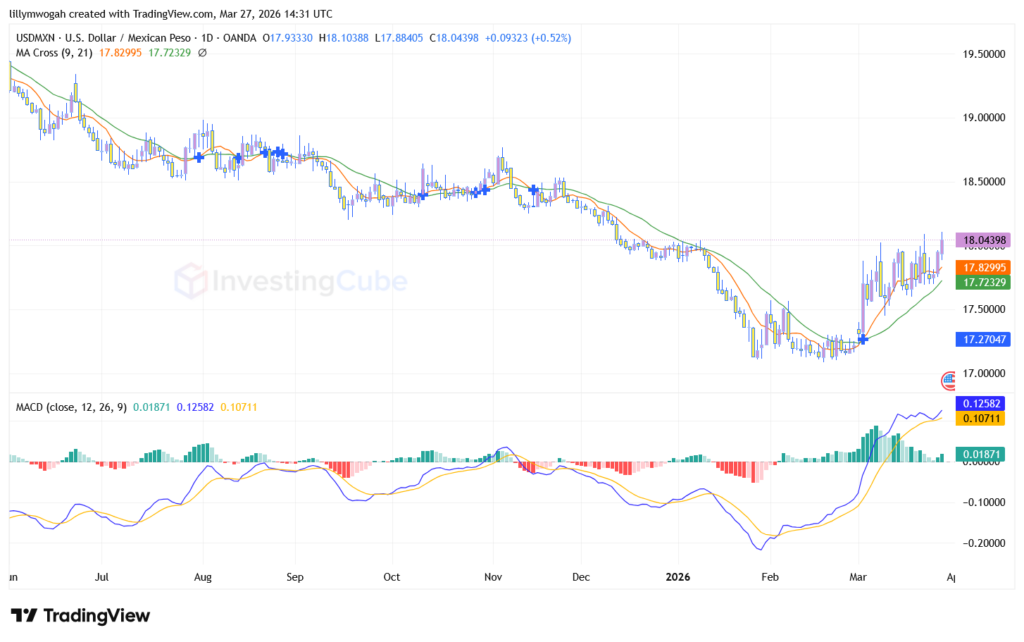
USD/MXN outlook: The outlook has turned bullish for the pair. The combination of local rate cuts and global safe-haven flows suggests a continued move toward the 18.50 region in the coming weeks.
Final conclusion & strategic outlook (week of march 30)
As we transition into the March 30 weekly open, the macro landscape is dominated by a flight to liquidity. The U.S. Dollar has cemented its role as the world’s primary safety play, leaving both commodity-linked and emerging market currencies vulnerable to further devaluation.
Traders should pay close attention to the following key developments:
- The April 6 Iran deadline: This is the primary “ticking clock.” Any failure in diplomacy before this date will likely keep oil prices pinned above $110 and the Dollar in a parabolic state.
- Bank of Japan “ambush” risk: With USD/JPY sitting at 159.89, the BoJ’s silence is becoming deafening. Watch for a “gap-down” at the Sunday open if intervention is triggered.
- G7 diplomatic meeting: Comments from France regarding the unblocking of the Strait of Hormuz will be critical; any sign that international aid is rebuffed will sustain the “Risk-Off” move.
Bottom line: Prioritize capital protection as volatility remains at multi-year highs. The primary focus remains on whether the DXY can turn the 100.00 handle into a permanent support floor and if XAU/USD can find a bottom before testing the 4,375 level.