The Fantom price prediction is taking a bearish turn following another round of intraday selling. What had looked like a bullish turn on the 4-hour candle of 9 January at 1600 hours was truncated at 2.5146, allowing the bears to storm into the picture with a series of progressively lower highs. This scenario set the pace for the 6% drop in price seen in the last 8 hours of trading on the FTM/USDT pair.
The intraday downturn followed the loss of buying momentum on other major cryptos, with Bitcoin losing the 42,000 mark it had attained earlier and Ethereum struggling to make the 3200 price mark.
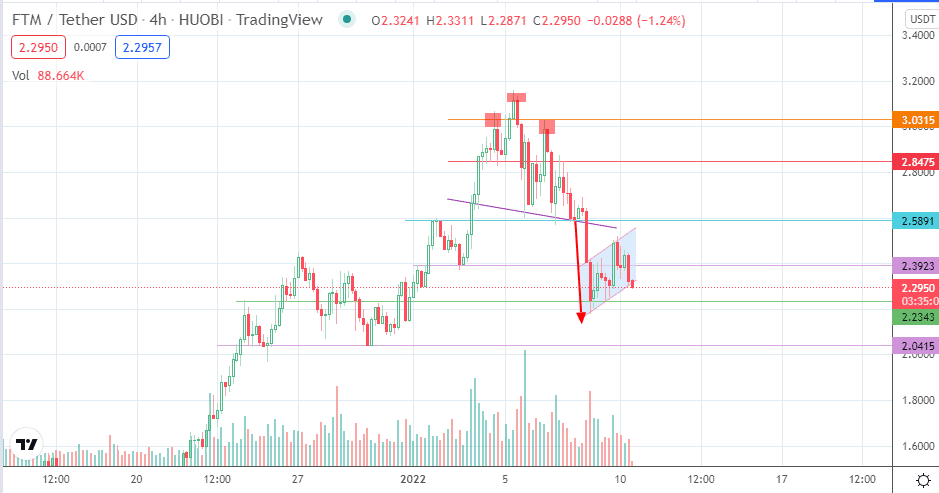
The price picture on the 4-hour chart following the resolution of the head and shoulders pattern is now one of an evolving bearish flag, seeking to complete the corrective decline indicated by the H&S pattern.
Fantom Price Prediction
With the emerging bearish flag pattern now on the verge of completion, the Fantom price prediction is for a measured move that takes it to the 2.0415 support (30 December 2021 low). If bearish pressure persists, even this support may not hold back the bears, allowing 1.8312 to come into the picture as an additional pivot.
On the other hand, failure to complete the flag pattern via a penetration close below the consolidation area, irrespective of the intraday violation, allows the bulls to test 2.3923 on the way to price discovery at 2.5891. If the bulls attain the latter, it puts this resistance in danger of a break. 2.8475 would be the target of a successful breakout, with 3.0315 also serving as an additional target to the north.
FTM/USDT: Daily Chart