
The EURJPY pair found support so far on each and every dip. Everybody in the currency market talked about the weak USD over the summer, but an equally important story was the strong Euro.
Euro outperformed its major peers too. The EURGBP hoovered close to the 0.90 level while the EURJPY rose from 117 to the current 126 area. Hence, it was not only a weaker USD theme but a generally stronger EUR.
Things changed dramatically this week. By the time the EURUSD reached 1.20, ECB had delivered a verbal intervention. Such interventions are casual in the currency market, but not from the ECB.
It shows the extent the ECB is willing to go to temper the Euro’s rise. Moreover, it came at the same day when inflation dropped well below expectations, with the core release reaching an all-time low at 0.4%.
With inflation close to deflationary territory and a very strong currency, the ECB has twice as hard a job to reach its price stability mandate. Hence, at least on the currency part, it may intervene to steam off the Euro rise. And, it did.
EURJPY Technical Analysis
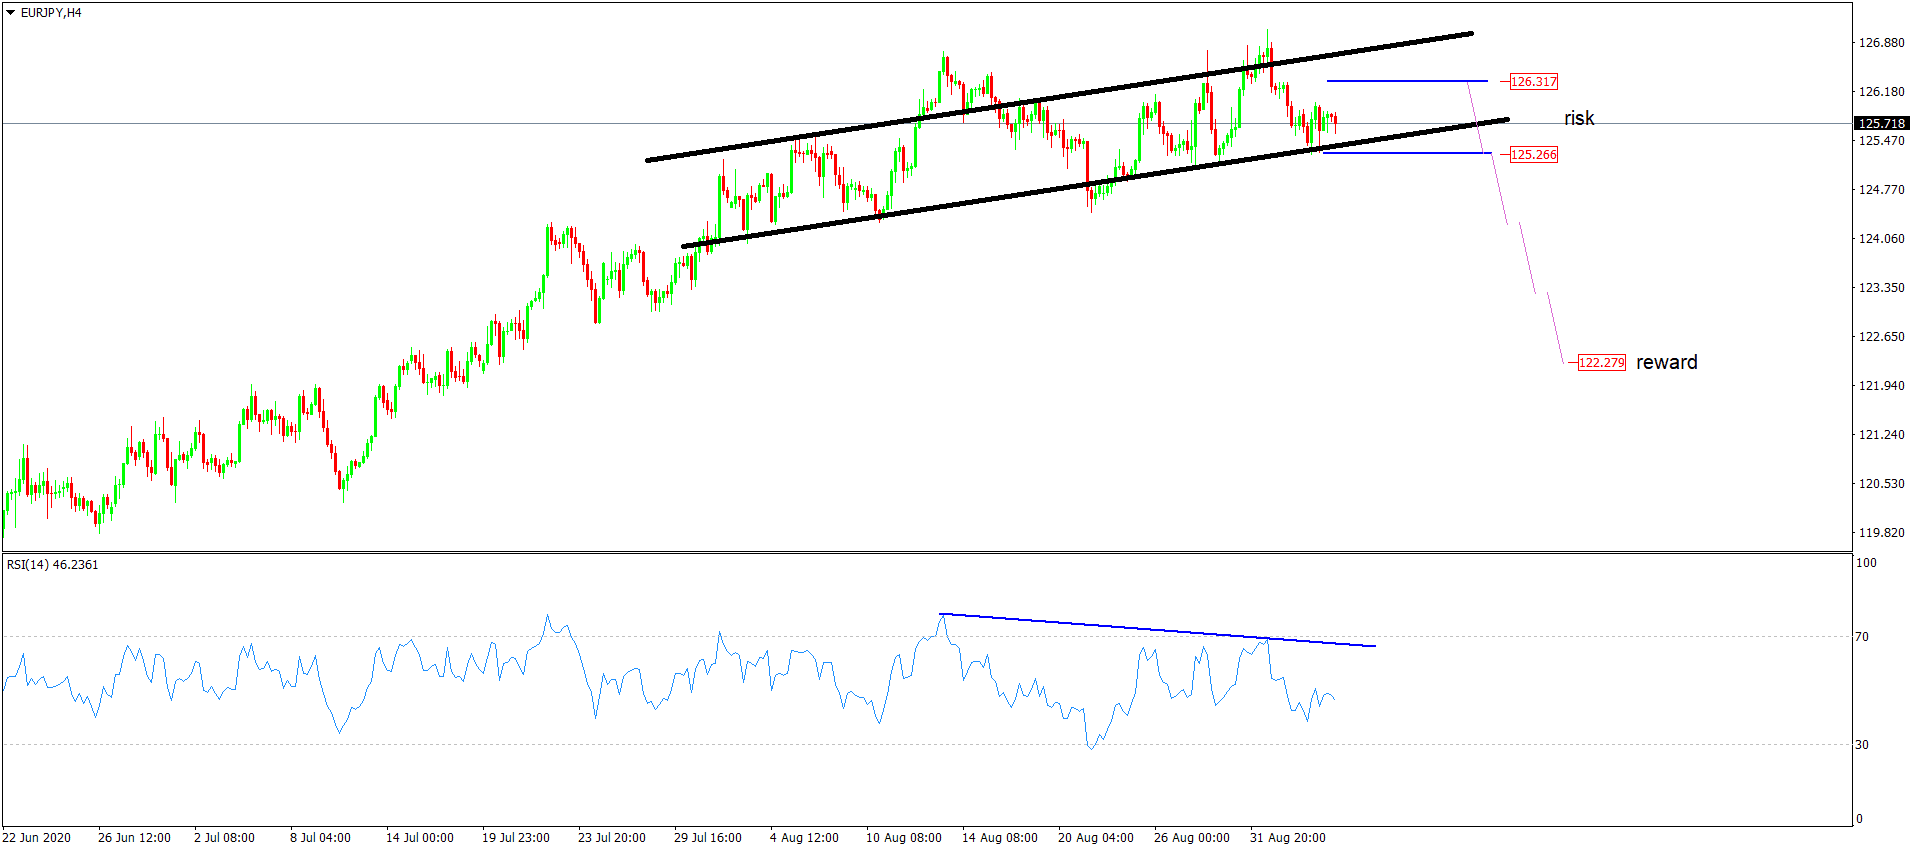
The EURJPY advance still has momentum. It makes higher highs and higher lows, meaning the bullish trend remains in place. However, some signs of weakness appear on the horizon.
On the one hand, the higher highs only show marginal advance. In other words, there is no continuation, and sellers step in on every new higher high.
On the other hand, if using a bit of imagination, we can see a head and shoulders pattern on the cross, with the EURJPY pair currently consolidating on the right shoulder.
Finally, the RSI and the price action diverge. Because this is the 4h chart, it matters for the medium-term perspective.
To trade a possible bearish break, consider placing a pending sell-stop order at 125.26 and a stop-loss at 126.31. By projecting the risk do the downside three times so as to use a risk-reward ratio of 1:3, the resulted target is 122.27.
For more about divergences, consider enrolling in one of our trading coaching programs.
Don’t miss a beat! Follow us on Telegram and Twitter.
Dow Jones Daily Chart
More content
- Download our latest quarterly market outlook for our longer-term trade ideas.
- Follow Mircea on Twitter.
- Do you enjoy reading our updates? Become a member today and access all restricted content. It is free to join.