
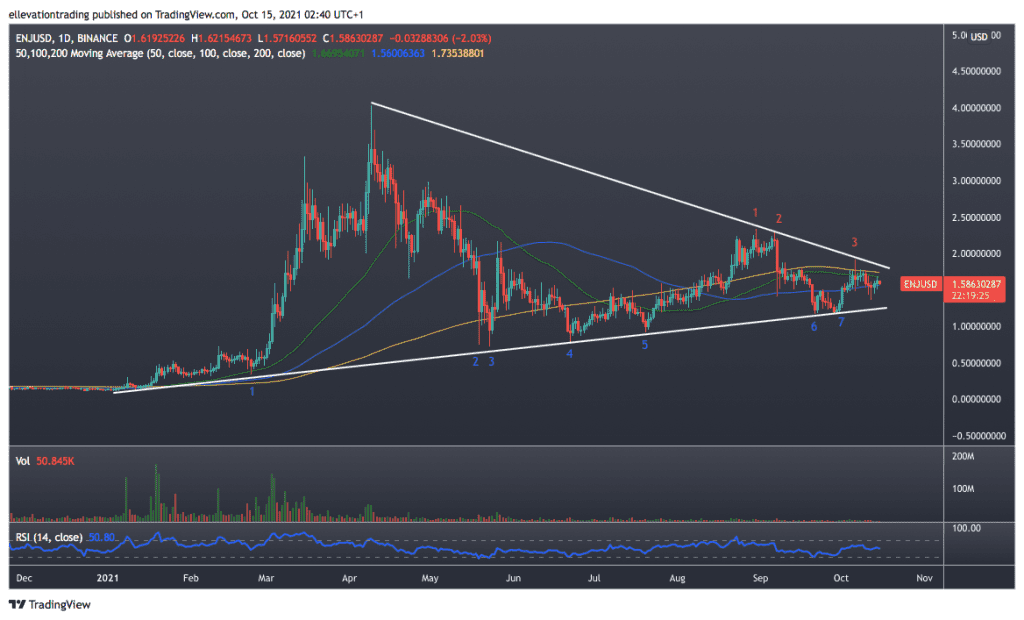
The Enjin coin price has retreated from trend line resistance over the last week and is now glued to the long term moving averages. Enjin Coin (ENJ) has traded in step with the broader altcoin market recently. The rally in August gave way to heavy liquidation in September before a mild recovery in October, which has since faltered.
Despite the combined value of the cryptocurrency market climbing to $2.37 Trillion over the last week, altcoins have underperformed. Bitcoin’s (BTC) dominance has increased to 45.5% as capital flows up the food chain ahead of a potential BTC-based ETF. As a result, Enjin Coin is suffering the same fate as many altcoins and struggling for direction in a narrowing range. However, bulls should be encouraged that ENJ is holding the long-term uptrend that has underpinned the 2021 ally.
ENJ Price Prediction
The daily chart shows that two opposing trend lines have dictated the Enjin Coin price action this year. The longer, more dominant uptrend is currently supporting the price at $1.250. A descending trend line from the March high counters the uptrend, offering resistance at $1.815. Additionally, the major moving averages are wrapped around ENJ, which further clouds the outlook.
Enjin Coin is trading at $1.580, just above the support of the 100-day moving average at $1.560. However, the 50-DMA at $1.669 and the 200 at $1.735 exert bearish pressure. If ENJ slips below the 100-DMA, a test of trend support should follow. On the flip side, clearance of the 200-DMA could set the price up for clearance of trend resistance. In that event, ENJ should advance to the September high of $2.330. However, the current outlook is neutral until Enjin Coin breaks the grip of the opposing trend lines.
Enjin Coin Price Chart (Daily)
For more market insights, follow Elliott on Twitter.