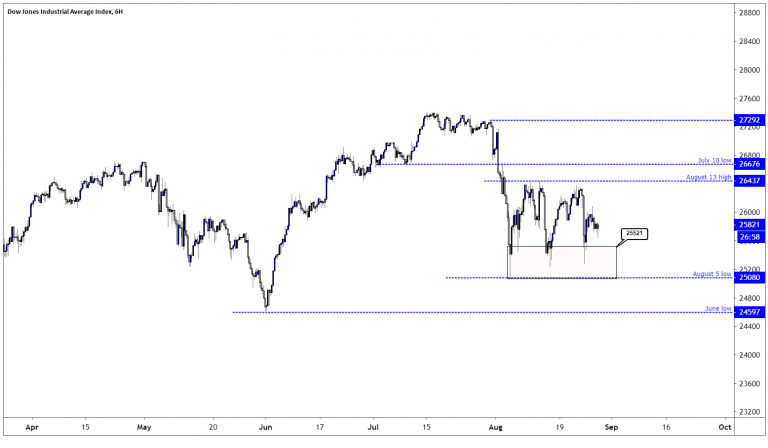
US Stock index futures like the Dow Jones are marginally higher today, and the Dow Jones index continues to trade sideways between the August 5 low of 25080 and the August 13 high of 26437.
The index started to trade sideways following a sharp 8% decline from the July 31 high of 27292 as the markets adjusted lower on the news that President Trump would increase import duty on Chinese imports. The situation has not improved since then, and trade wars have escalated with a new round of tariffs by the Chinese government. Leading economic indicators such as the US Markit PMI report have declined and suggesting a weaker US economic growth going forward. The latest figure suggested that annualized US GDP growth was at 1.5%. The US central bank, the Federal Reserve, have also indicated that they are in no rush to cut interest rates per the magnitude that the rates markets were projecting and has therefore reduced the appetite for stocks.
On July 26 the market projected a 50-bps rate cut at the FOMC September 18 meeting with an 11.3% probability, today on August 28 the expectations for the same is at 5%. Going forward, the rates markets imply a 25-bps rate cut at the FOMC September 18 meeting, followed up by at least another rate cut in before the end of the year, possibly at the December 11 meeting.
There is no doubt that lower interest rates and the sharp drop in long-term interest rates are supporting stock markets, however, traders struggle to figure out if it will be enough to cause the Dow Jones index to add to its gains.
From a technical view, the Dow Jones index trend is upwards above the August 5 low of 25080, and traders have been buying dips between 25080-25521, and this is expected to continue. If the August 5 low holds, the price might revisit the August 13 high of 26437. However, a break to the August 5 low might send the index towards the June low at 24597, with a slide below the June low probably starting a steeper decline in the index.Don’t miss a beat! Follow us on Telegram and Twitter.
Download our latest quarterly market outlook for our longer-term trade ideas.
Do you enjoy reading our updates? Become a member today and access all restricted content. It is free to join.