Dogelon Mars prices have dropped by almost 10 per cent in today’s trading session. In the past few days, the prices have gone from trading at $0.0000014 to the current price of $0.0000008. This is a 42 per cent decrease since March 28.
In the last 24 hours, Dogelon Mars has seen its trading volume increase by over 77 per cent. Normally, this would have seen the cryptocurrency change its current bearish trend to a bullish trend. This is because Dogelon Mars is a memecoin that is mostly driven by how many users trade it or use it in their day to day activities. However, even with the surge in trading volume in the past 24 hours, the prices continued to drop.
Dogelon Mars Price Prediction
To understand what is currently happening in the Dogelon markets today, we have to look back at my March 28 price analysis. In my analysis, I predicted the prices would be trading at the $0.0000012 resistance level soon. I also indicated that if the prices continued with their current volatility, Dogelon Mars was likely to hit the $0.000002 level. Today, the prices were able to break out of the $0.0000012 resistance level. However, the volatility was not big enough, and the prices fell short of reaching the $0.000002 price level.
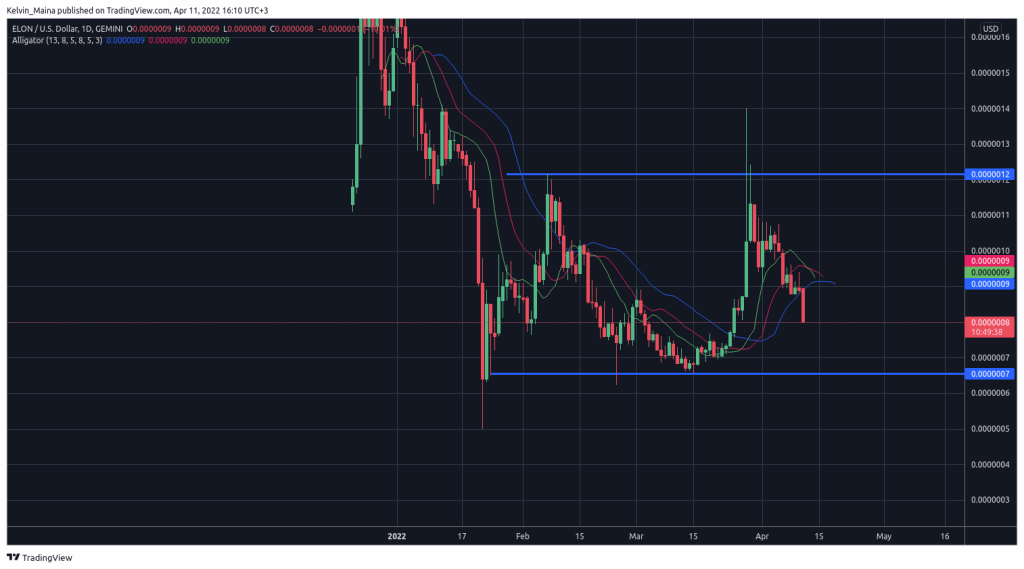
Since then, Dogelon Mars prices have decreased more than 42 per cent to their current price of $0.0000008. Looking at the daily chart below, we can also see the prices are coming from the resistance level of $0.0000012. Therefore, the current downward move may be headed to the $0.0000007 support level. Based on the daily chart, I also expect the prices to go below the support level. However, this will depend on the volatility the bearish move will have during the next few days. The Williams Alligator indicator also shows signs of a long-term bearish move, another sign that the prices are likely to break the support level.
Dogelon Daily Chart