
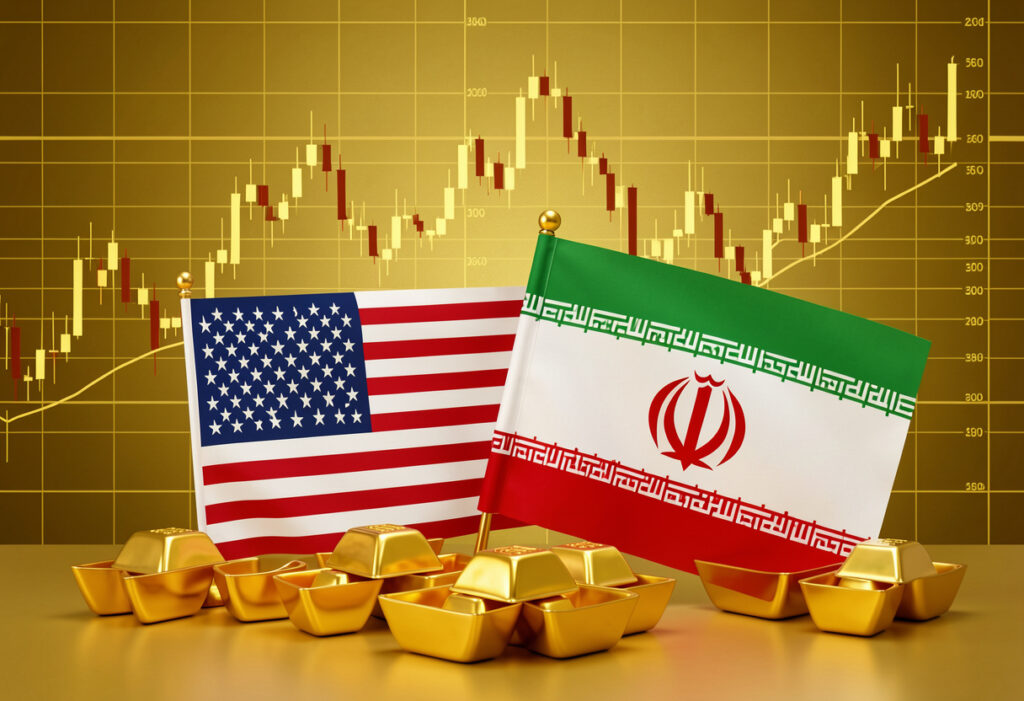
- Gold remains in a broader bullish trend but is currently consolidating as traders adopt a cautious stance ahead of key US inflation data.
- Geopolitical tensions and expectations of potential Federal Reserve rate cuts continue to provide underlying support for the precious metal.
The gold spot price opened at $5,191.79 per ounce on Wednesday, down 0.11% or 5.14 points from yesterday’s close at $5,192.51. Gold strengthened after U.S. President Donald Trump said that the war could end “very soon.” But Iran has rejected calls for a ceasefire and signaled it will continue military operations. The country is also stating that it will determine the timing and conditions for ending the war. This increases the uncertainty sentiment in the global markets. Moreover, other factors are acting as tailwinds for the non-yielding yellow metal, such as:
- Traders stepped in to buy the dip in the US dollar. This has led to a rebound of the US dollar from its one-week low. This creates headwinds for the gold price.
- Despite the dollar’s rebound, its upside remains capped as traders doubt the strength of the move.
- Market participants believe that the current crude oil prices are not high enough to significantly increase inflation. This will potentially leave room for the Federal Reserve (Fed) to cut interest rates.
- The International Energy Agency is planning to release a large amount of oil reserves to cap and lower oil prices during the ongoing US-Israel-Iran conflict. This could reduce inflation risks and support gold.
- Lower oil prices may stabilize or ease inflation pressure, allowing the Federal Reserve to continue cutting interest rates. In this case, the US dollar will weaken and support the dollar.
- However, the ongoing war between the US, Israel, and Iran increases uncertainty, which boosts demand for gold as a safe-haven asset.
- Trading sentiments are currently cautious ahead of the US Consumer Price Index report, which could influence the Fed’s next interest rate decision.
- Additionally, the personal consumption expenditure price index data will be released later this week. This may affect the US dollar and gold prices.
Gold remains in a cautious holding pattern as traders await key economic data that could provide clearer clues about the metal’s next directional move.
The Technical Outlook for Gold Price:
The chart shows that Gold remains in a broader bullish trend, supported by the rising long-term moving average. The moving average continues to slope upward and acts as dynamic support. As long as the price action is trading above this major moving average, the long-term trend structure will remain positive despite the recent consolidation phase.

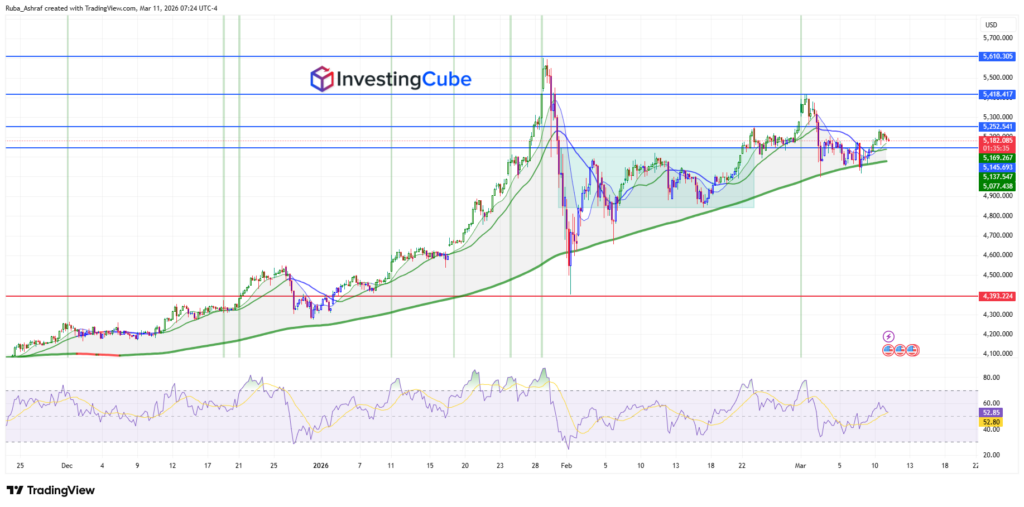
Currently, gold is trading inside the highlighted consolidation zone between roughly $5,145 and $5,252. This represents a short-term range where buyers and sellers are balancing each other. The $5,252 level acts as immediate resistance, and a decisive break above it could pave the way for another test of $5,418. Then, it will be followed by the major resistance near $5,610, which marks the previous peak.
On the downside, $5,145 serves as the first key support, aligning with the consolidation base and recent price rebounds. A break below this level could expose $5,137 and $5,077, while the deeper structure support remains much lower near $4,393. The shorter-term moving averages (the thinner blue and green lines) reflect the recent consolidation. However, the averages are beginning to stabilize and slightly turn upward. This suggests that bullish momentum could gradually rebuild if buyers regain control above the range resistance
The Relative Strength Index (RSI) is hovering around the mid-50 level, indicating neutral to slightly bullish momentum. This neutral momentum aligns with the sideways price structure and suggests that traders are likely waiting for a catalyst before committing to a stronger directional move.
Overall, the technical structure suggests that gold remains in an underlying uptrend, but in the short term, the market is consolidating within a range. A clear breakout above $5,252 would likely signal renewed bullish momentum toward higher resistance levels.
Gold is moving in a consolidation range as investors wait for key US inflation data, which could influence the Federal Reserve’s interest rate decisions.
Ongoing geopolitical tensions, a weaker US dollar outlook, and expectations of potential Fed rate cuts are supporting demand for gold as a safe-haven asset.