

- Gold prices remain under pressure as traders balance geopolitical uncertainty surrounding Iran against shifting expectations for US monetary policy.
- From a technical perspective, gold remains in a fragile recovery phase, with traders monitoring whether prices can break key resistance levels or resume the broader bearish trend.
Gold stabilizes at $4,550 after declining from $4,770 during a four-day sell-off. Traders are waiting for any new developments in the Middle East conflict. According to the Iranian Foreign Ministry, the US-Iran talks are ongoing. An Iranian official stated that Washington and Tehran are analyzing a recent peace proposal that lifted sentiment this morning. Additionally, Iranian and Omani technical teams were discussing options to restore safe transit through the Strait of Hormuz. Broader fundamentals are forcing gold to the edge. Besides the geopolitical tensions, the US monetary policy and the new era with former governor Kevin Warsh, who is soon to be sworn in as chair, are key factors.
First, let’s get a technical perspective on gold, looking at the recent price action, key market moves, and likely bullish and bearish scenarios shaping the near-term outlook. Then we’ll get to the fundamentals.
Gold Price Technical Outlook:
The XAUUSD 4-hour chart reflects a market that remains under medium-term bearish pressure despite attempts to stabilize near the recent lows. The gold price continues to trade below the major long-term moving average. The yellow metal’s repeated failures near the 4,654 resistance zone highlight present selling pressure. The shaded red rectangle on the chart represents a prolonged consolidation and disruption phase where bullish momentum gradually faded before the latest downside continuation.

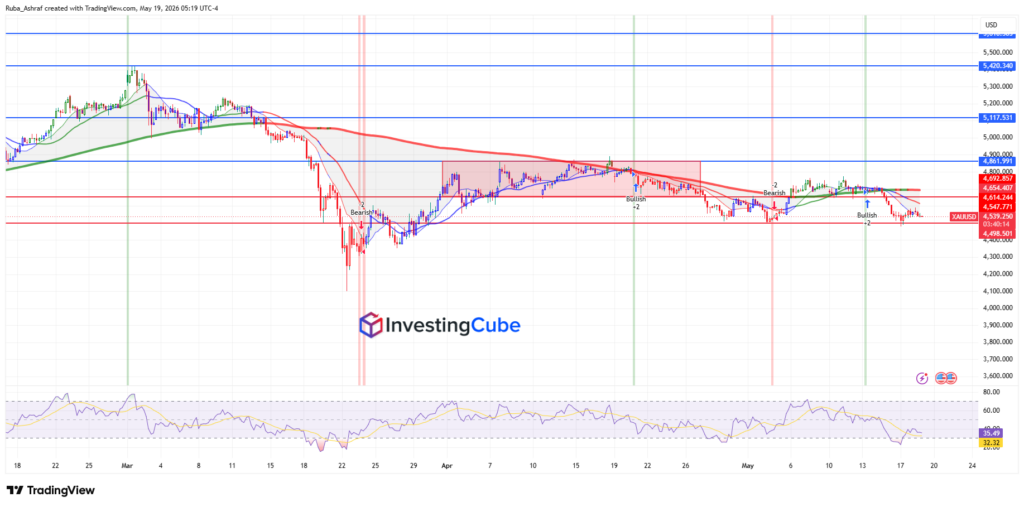
Technically, the moving averages continue to signal weakness in the broader trend. The short-term blue moving average is still below the medium-term red average, while both are below the longer-term trend indicator. This is generally a sign of bearish market structure and weak upside momentum. Despite some recovery attempts from the 4,498 support area in recent candles, buyers have not been able to reclaim key resistance levels decisively.
The RSI dipped into oversold territory before rebounding slightly, which indicates that the bearish momentum could be easing for a while. However, the RSI is still below the neutral 50 level, suggesting that the bullish conviction is still limited and the recovery is not strongly confirmed by momentum for now.
From a price action perspective, the 4,498 support zone remains a critical near-term level. This area has repeatedly attracted buyers and prevented a deeper decline. A decisive hold above this support could encourage another attempt toward the 4,572 and 4,654 resistance levels. Beyond that, a breakout above 4,699 would likely improve the broader technical outlook and potentially pave the way toward 4,861.
Gold Price Potential Scenarios:
- The Bullish Scenario: It would likely emerge if gold manages to establish stability above short-term moving averages and break through the 4,654-4,699 resistance region. Such a move could be a sign that buyers are taking back control and could trigger stronger upside momentum toward higher resistance zones.
- The Bearish Scenario: The gold could come under renewed selling pressure if it fails to hold support at 4,498. A confirmed breakdown below this area reinforces the broader bearish structure and may accelerate losses toward support zones.
Moving forward to fundamentals that reinforce caution in trading gold prices, the key fundamental factor is related to US monetary policy and Kevin Warsh, who will be sworn in as Fed chair soon. That would mark a new era for US monetary policy under Trump’s influence, as Warsh was chosen by Trump. Let’s look in detail at how this affects traders’ decisions and market sentiment.
The key fundamental drivers affecting gold prices:
- Markets are treading carefully as uncertainty grows about the future direction of US monetary policy and possible leadership changes at the Federal Reserve.
- Dovish Interest Rate Expectations: Gold is supported by expectations that the Fed may eventually lean toward rate cuts, lowering the opportunity cost of holding non-yielding assets.
- Demand for safe-haven assets such as gold is rising amid investor fears over political interference in the Federal Reserve.
- The US dollar is fluctuating due to the uncertainty of future policy decisions, and this has a direct impact on gold prices because of the inverse relationship between the two.
- Defensive flows into gold continue to be supported by ongoing geopolitical tensions, including developments relating to Iran and wider global instability.
- Shifts in US bond yields remain a major factor, as lower yields tend to improve gold’s attractiveness relative to interest-bearing assets.