
- Gold stays under $5,000 as traders await US CPI data to gauge the Fed’s 2026 interest rate path.
- Russia’s proposal to return to the US Dollar settlement system has shattered de-dollarization bets.
- Technical charts show a symmetrical triangle, signaling a massive Gold breakout after the CPI news.
Gold Price Outlook: Navigating the Post-Shock Landscape
Gold prices are currently traversing a “minefield” of competing narratives this Friday, February 13. For months, the $5,000 per ounce level acted as an unbreakable ceiling, but its recent breach to the downside has transformed it into a formidable wall of resistance.
While the metal has managed a tentative intraday bounce to $4,971, the recovery remains fragile as investors wait to see if the recent “risk-out” event was a temporary glitch or the start of a deeper correction.
The immediate focus for every bullion trader today is the US inflation report (CPI). Following Wednesday’s blowout jobs data, which saw the US economy add a massive 130,000 positions, the “higher-for-longer” interest rate narrative is back with a vengeance. A hot CPI print today would likely be the final nail in the coffin for any remaining hopes of a spring rate cut, potentially driving Gold back toward the $4,881 weekly low.
The Russia-US Dollar Twist: Why the Safe-Haven Narrative is Faltering
The most disruptive news hitting the wires today involves a potential 180-degree turn in global currency dynamics. Reports originating from an internal Kremlin document suggest that Russia is examining a return to the US Dollar settlement system as part of a proposed economic framework with the Trump administration.
This news has acted as a “black swan” for precious metals for three reasons:
- The End of “De-Dollarization” Hype: Much of Gold’s 17% gain this year was predicated on BRICS nations abandoning the Dollar. A Russian pivot back to the Greenback completely undermines this bullish pillar.
- Resource Cooperation: The framework reportedly includes joint US-Russia ventures in natural gas, offshore oil, and critical raw materials like nickel and palladium, signaling a period of potential geopolitical cooling.
- Dollar Dominance Reborn: If the world’s most sanctioned nation moves back toward the Dollar, it reinforces the Greenback’s status as the ultimate global reserve, reducing the need for Gold as a systemic hedge.
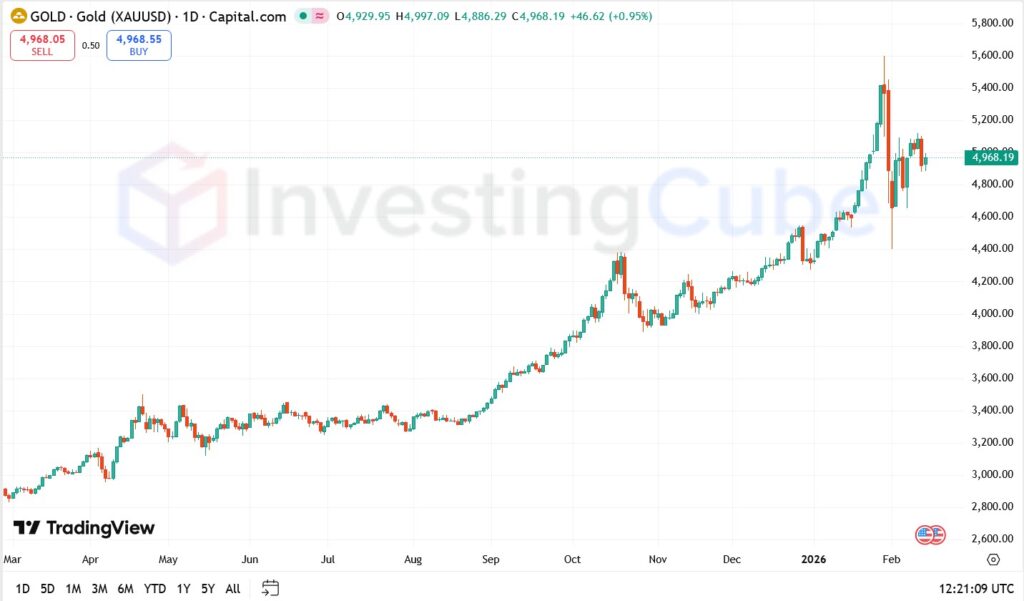
Gold Price Chart Analysis: The “Bull Trap” at $5,000
XAU/USD is currently a “coiled spring” as it hovers near $4,970 this Friday. After the devastating “black swan” drop from Russia-US dollar rumors, the chart has shifted from an aggressive rally into a high-stakes consolidation zone. We are seeing a classic symmetrical triangle on the 1-hour chart, meaning a massive breakout is imminent—and the US CPI data is the only trigger left to pull.
Gold’s Major Resistance $5,110 – $5,130The “Breakout Zone.” Reclaiming this confirms the bull run is back on.
Gold’s Immediate Resistance $5,000The “Psychological Wall.” Needs a 4H candle close above to flip sentiment.

CPI Inflation Report: How Today’s Data Could Move Gold Prices
The “Hot” CPI (Inflation > 2.6%)
If inflation comes in higher than expected, the Federal Reserve will likely keep rates “higher for longer.” This will send the US Dollar skyrocketing.
- The Move: Gold will likely shatter the $4,940 support instantly.
- Target: Watch for a rapid decline toward $4,880, with a potential “flush” all the way down to the $4,800 level as margin calls trigger.
The “Cool” CPI (Inflation < 2.4%)
If inflation shows a sharp cooling, the “March Rate Cut” dream stays alive, and the US Dollar will give back its recent gains.
- The Move: A massive “short-squeeze” will likely propel Gold back above the $5,000 handle.
- Target: Look for an immediate retest of $5,050, with a secondary target of $5,110 by the weekend close.
Gold Price Prediction: Will the $5,000 Support Hold or Fold After CPI?
The immediate fate of the precious metals complex rests entirely on today’s inflation verdict. If the US CPI print reveals that inflation is cooling faster than anticipated, it could provide the necessary fuel for Gold to reclaim its $5,000 throne and for Silver to erase its 10% weekly deficit.
However, a “hot” report would likely solidify the US Dollar’s dominance, potentially driving a deeper liquidation toward the $4,880 support zone. For investors, the next few hours will determine whether this week’s “Russia-Dollar” shock was a temporary trap or the start of a broader structural shift in the 2026 bull market.