The CAC 40 index is trading 0.71% lower, increasing the chances of the market entering a period of correction as it responds negatively to the latest US jobs report. As a result, any earlier gains in the CAC 40 index have been erased. However, the French stock market is still hanging on to some gains for the week. It is currently up 14.69 points, but its ability to hang on to these gains will depend on some late demand pressure to save the market’s weekly open at 6447.
The recent rally in the CAC 40 index that has seen the market gain 8,87% in July and 0.38% this August came on the heels of upbeat GDP readings for France. The French economy grew 0.5% quarterly in Q2 2022, according to data released in the last week of July by the National Statistics Institute INSEE. This reading exceeded market expectations by 3 percentage points, leading to the recent rally.
The technical outlook indicates that the CAC40 is approaching a major resistance that has held for four months. This could be an attractive position for those wanting to initiate shorts to catch a potential correction. However, these have to contend with the recently broken 200-EMA line.
A successful downgrade of this moving average, now acting as dynamic support, could lend credence to this countertrend positioning. However, this contrarian positioning could fail if the bulls defend the 200-EMA and breach the 4-month-old resistance.
CAC 40 Index Outlook
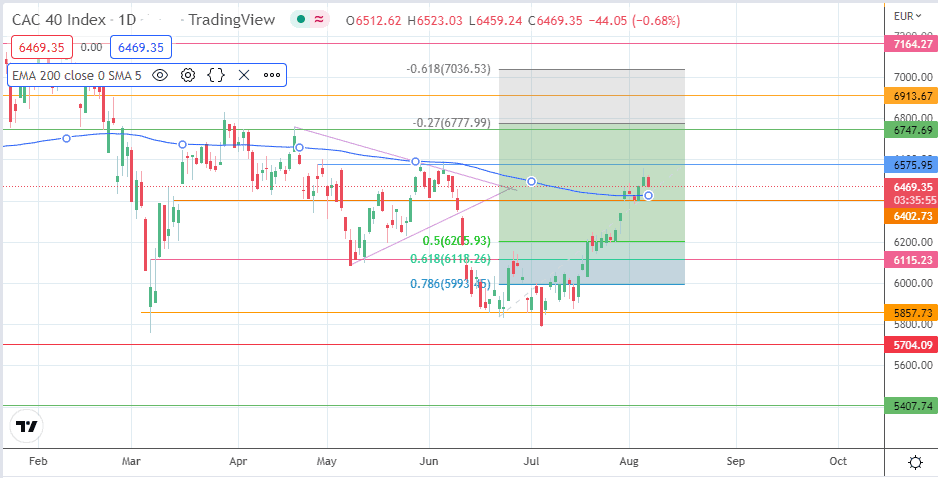
The recent rally is expected to meet resistance at the 6575 price level. This barrier is a major one, having capped any upside moves since the 28 April peak. A clearance of this barrier takes the advance toward the 6747 resistance (21 April high), with 6913 (4 February low and 23 February high) and 7164 (10 February 2022 high) serving as additional harvest points for the bulls. This move has to follow the formation of a bullish outside day candle with a penetration close above the 6575 resistance that confirms the harami pattern.
Failure to establish this confirmation could lead to rejection and a pullback from this point. This sets up a correction that targets the 4 May and 3 August lows at 6402 as the initial downside target. An additional price point of note to the south that could serve as support includes the 6200 psychological support and the 27 July low, which is also the site of the 50% Fibonacci retracement level from the 22 June (swing low) to the 4 August (swing high) price swing. 6118 and 5993 are the 61.8% and 78.6% Fibonacci retracement levels, respectively. They form additional harvest points for the bears if there is a deeper correction.
CAC 40 Index: Daily Chart