The BlackBerry share price slipped 4% on Tuesday to the major support of the 200-day moving average and an uptrend in place since last year. Furthermore, a robust descending trendline weighs down the price and could soon force Blackberry to break down.
BlackBerry Ltd (NYSE: BB) has struggled this month. So far, BB is down more than 16% since the start of September and 50% below the June high. Unfortunately, there are no immediate signs that the software and cyber-security company can turn things around. In fact, a weak close today could be the catalyst for the BlackBerry bulls to throw in the towel finally.
The hype that surrounded BB earlier this year appears to have abated. The stock was once a darling of the wallstreetbets crowd, which helped it jump over 550% to $28.77 between November 2020 and January 2021. However, since then, apart from a brief spike to $20.17 in June, the Blackberry share price has been on the slide.
Even though yesterday’s closing price of $10.04 is a 45% increase year-to-date, the bulls must now be getting nervous. Unfortunately for shareholders, the price action has been awful, and the trading volume indicates a real lack of interest. Even the high short interest of 8% has failed to entice buyers into this dip, which is concerning.
The retail crowd may have just moved on to greener pastures. Recently, quick bucks have been made in cryptocurrencies and uranium stocks such as Cameco (NYSE: CCJ). This may have resulted in the loyal fan base no longer providing a bullish kicker for the BlackBerry share price.
BB Price Analysis
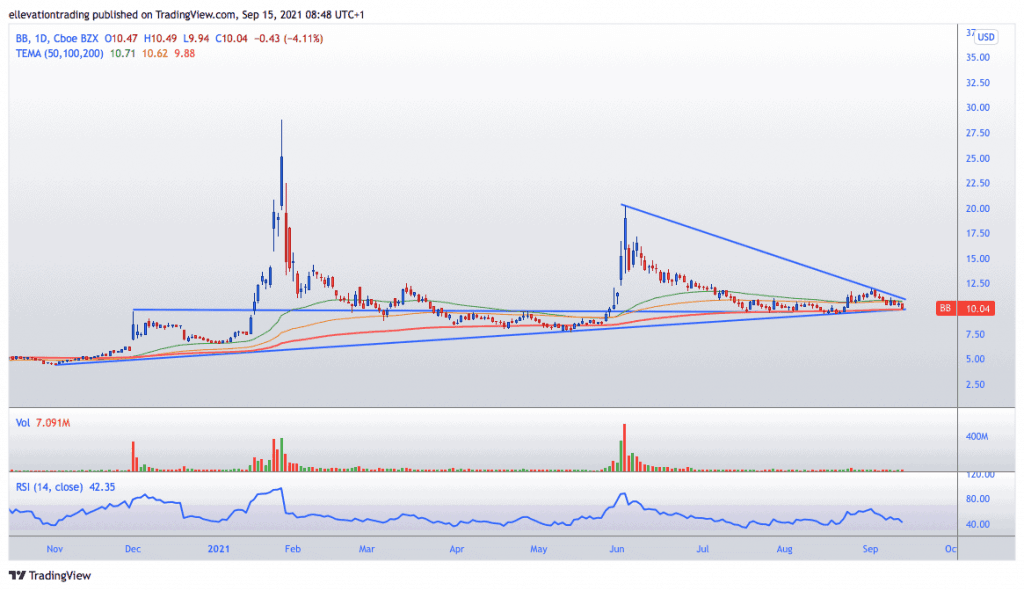
The daily chart shows BB is locked between trend resistance at $10.80 and trend support at $9.90. Furthermore, the major averages lend weight to both sides.
Above the market, the 50-day at $10.71 and the 100-day at $10.62 reinforce the resistance. Below, the significant 200-day average at $9.88 bolsters the support.
Depending on which is first to fall will dictate what comes next. If BB drops below the 200-day moving average and the trend support, I expect a serious leg lower, targeting the May low of $7.77.
However, if BlackBerry breaks out on the upside, a test of the 1st of September high of $12.01 should follow. Furthermore, above $12.01, an argument can be made for another run at $20.00.
BlackBerry Share Price Chart (Daily)
For more market insights, follow Elliott on Twitter.