The Bitcoin price prediction for today is not good news for buyers. The daily chart of the BTC/USDT pair is ominous, as the pattern is pointing to a steep drop that could touch off the 19k price level. But where is the market right now?
The transaction history on the biggest crypto exchange by volume indicates that 1.350,194 addresses bought 926,620 BTC at an average price of $29.814.67. There is a supply wall at $34,434.10, where 386,280 addresses are holding 243,403 BTC.
Technically speaking, the death cross of the 50-day and 200-day moving averages has developed on the 3-day chart of the BTC/USDT pair. This bearish setup indicates a potential for any rebound to be capped at any price between $34,434 and $38,531. Even as Binance futures reveal that the long/short ratio is 1.91 and 65.85% of all accounts are net long, the daily chart shows that the highs of the daily candles are getting progressively lower. What does this mean in terms of Bitcoin price predictions?
Bitcoin Price Prediction
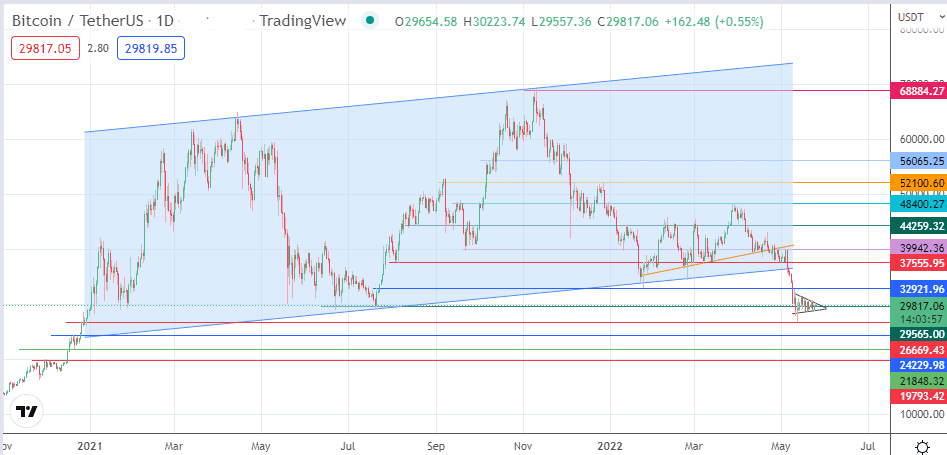
The signs are all bearish. The trendline that supported the lows of 21 January to 24 April was breached to the south. The large ascending channel also had its lower border broken by the 6 May candle. The resulting downward move has formed the pole of the evolving bearish pennant. The day’s price action met resistance at the pennant’s upper border but still remains above the 29565 price mark, which now functions as a support.
This support needs to give way for the pennant’s lower edge to undergo a test of its integrity. If this pennant is degraded and the price drops below the 11 May low, the 12 May low at 26700 becomes the immediate target. Only a conclusive penetration close below this point opens the door towards 24295 (20 December 2020 high). The measured move is expected to end at 21815 (21 December 2020 low). However, 19888 (1 December 2020 high) could become an additional downside target if the drop continues.
On the flip side, the negative outlook remains invalid if the price action stays above the 24 January low at 32921. In addition, the 7 March/14 March/1 May lows at 37555 are a resistance barrier that needs to give way for the price to inch towards the 39950 price level (15 March and 5 May highs). Above this level, 42500 (9 March high) and 44260 (27 September 2021 and 14 January 2022 highs) remain viable targets to the north.
BTC/USDT: Daily Chart