Bitcoin price predictions remain bearish after the price activity failed to break the 21631 resistance level on 21 June. This price rejection left the bears in control, and they decidedly drove prices down to the 20113 support level.
What is currently happening is an ongoing, silent accumulation by the whales. Binance exchange was reported to have amassed more than 100,000 BTC at the current lows. It has also emerged that there has been an increase in the number of large BTC holders by 16%, according to data from IntotheBlock’s Twitter page. This accumulation is why further bearish Bitcoin price predictions have not been achieved yet.
The recent capitulation in BTC prices comes as central banks raise interest rates, driving investment flows from risky assets to money-market instruments. With Fed Chair Jerome Powell due to provide testimony on Wednesday and Thursday before the committees in the Senate and House of Representatives overseeing the financial markets, we could see some volatility in the BTC/USDT pair within the week.
Bitcoin Price Prediction
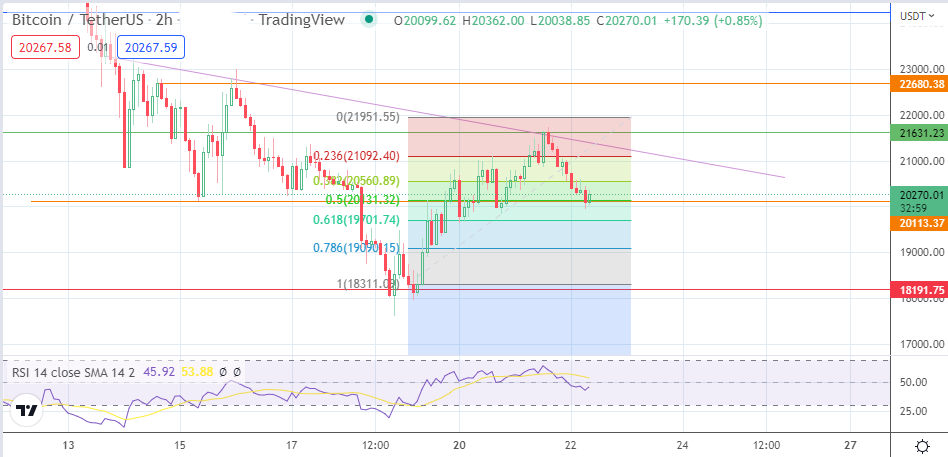
The 2-hour chart shows that the price activity has bounced off the 20113 price mark, where the 50% Fibonacci retracement level from the swing low of 18191 to the swing high of 21848 is found. This is expected to be the support for price action on the day. However, the momentum must carry upwards to the descending trendline and breach it before the bulls can attain the 21631 resistance level.
A bullish outside day candle must emerge to support the evolving bullish harami candle if the price action is to surpass the 38.2% Fibonacci retracement level at 20560. The 23.6% Fibonacci retracement level at 21092 could also serve as a potential pitstop area on the way up. An additional short-term resistance level lies at 22680.
On the other hand, a breakdown of the 20113 price support allows the price action to test the 61.8% Fibonacci retracement level at 19701, where the low of the midnight 2-hour candle of 20 June resides. A further trip to the south brings 19090 into the mix, with this level being the 78.6% Fibonacci retracement level. 18191 remains the next target to the south, marking the double bottom that signified the rally point of 19 June following the test of this price level.
BTC/USDT: 2-hour Chart