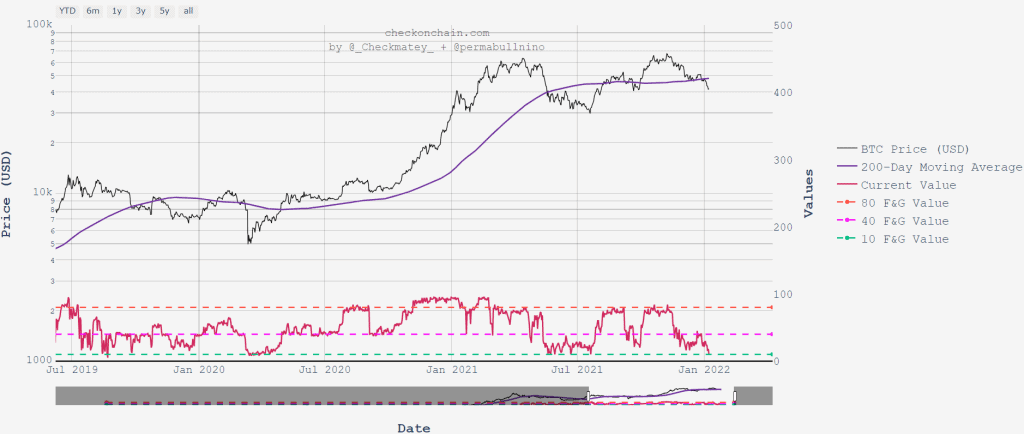
The king of crypto, Bitcoin, is still trading on the lower side giving a clue of dropping further. The Crypto Fear & Greed Index has a score of 23, which indicates “extreme fear” in the market. The sentiment here shows that the investors are worried about their bitcoin investment.
Bitcoin prices have taken a step lower as the US Federal Reserve has made it clear that they intend to rapidly reduce its asset purchases, followed by three rate hikes in 2022. Yet the latest twist in this story is that they also aim to reduce their balance sheet, which the market did not expect so early in the process.
Normally, conversations about a balance sheet reduction would occur at the end of the current QE program, and possibly as soon as after one rate hike, to see how the economy would hold up to the first two steps of the normalization process.
Today, Alex Kruger, the founder of Aike Capital, predicts that Bitcoin prices might fall further if the US inflation keeps gaining more than projected by economists. The next US inflation figures are due on Wednesday, 12th Jan, at 8:30 EST.
According to a Bloomberg economist survey, the annual US consumer price index is expected to rise 7% through December and 0.4% month-over-month.
Typically, inflation would be around the 2% mark, hence a 7% up move in the CPI explains why the US Federal Reserve officials have wanted a more instantaneous normalization of their monetary policy than expected earlier.
Additionally, the nonfarm payroll employment data released on 7th Jan meets the normalizing condition of the labour market set by the Federal Reserve.
Bitcoin Technical Analysis
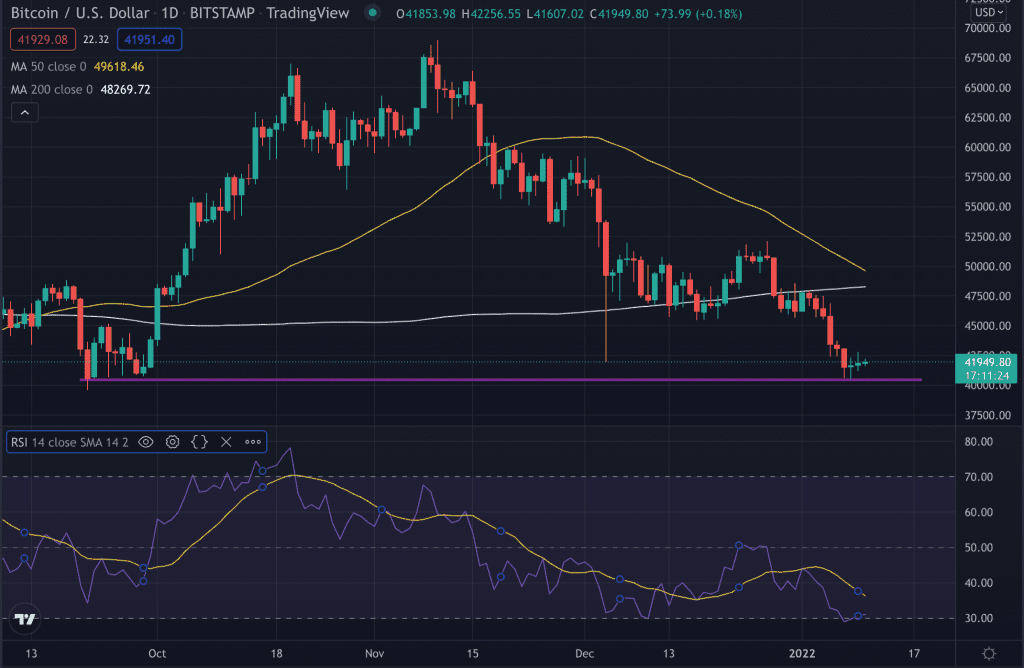
Bitcoin is currently trading at $41,999, reaching a high of $42,663 in the previous 24hr. The overall market condition is on the bearish side, showing no sign for an up move.
On the daily time frame, the price formed a support zone at $40,544. The price further bounced from the same level on 22nd Sept 2021, increasing the importance of this support level.
If the price manages to slide below the 22nd Sept low, then it might send BTCUSD to the next support level, the August low of $37,331, followed by the 11th Jul high of $34,706.
However, several Doji candles have formed above the 22nd Sept low in the last few days, and it is a pattern that suggests that the selling pressure is abating. Yet, it is too early to know if the price will turn higher.
Is a Death Cross looming?
In the daily chart seen below, the yellow line represents the 50MA while the white line represents the 200MA. We can see that the 50MA is approaching the 200MA, and if the 50MA crosses below the 200MA, there will be a death cross that might lead to further prices losses.
BTCUSD Daily Chart