
The Bitcoin price made a sharp reversal from last week’s $66,999 all-time high to $59,500 this morning before bouncing $2,500 to $62,000. The bears took advantage of the thin liquidity to search for stops below $60,000 several times over the weekend. This morning, BTC slid to $59,500, but like previous trips below $60k in the last two days, bulls emerged on the dip and pushed the price back towards $62,000.
The long-awaited launch of a Bitcoin (BTC/USD) ETF propelled BTC to a new record last week. However, since then, the price has followed the adage of ‘Buy the rumour and sell the fact’. BTC was down 11% from Thursday’s high at this morning’s low and looked vulnerable to a much-steeper decline. However, the bulls are not going down without a fight and bravely defended the psychological $60k threshold, forcing the price to its current level of $61,750. However, our premium Bitcoin report released on Friday highlights evidence to suggest that long-term holders are selling into this rally. Furthermore, recent deliveries of BTC onto exchanges and an increase in Leveraged longs add to the bearish sentiment. However, for now, the bulls are in the driving seat.
BTC Price Forecast
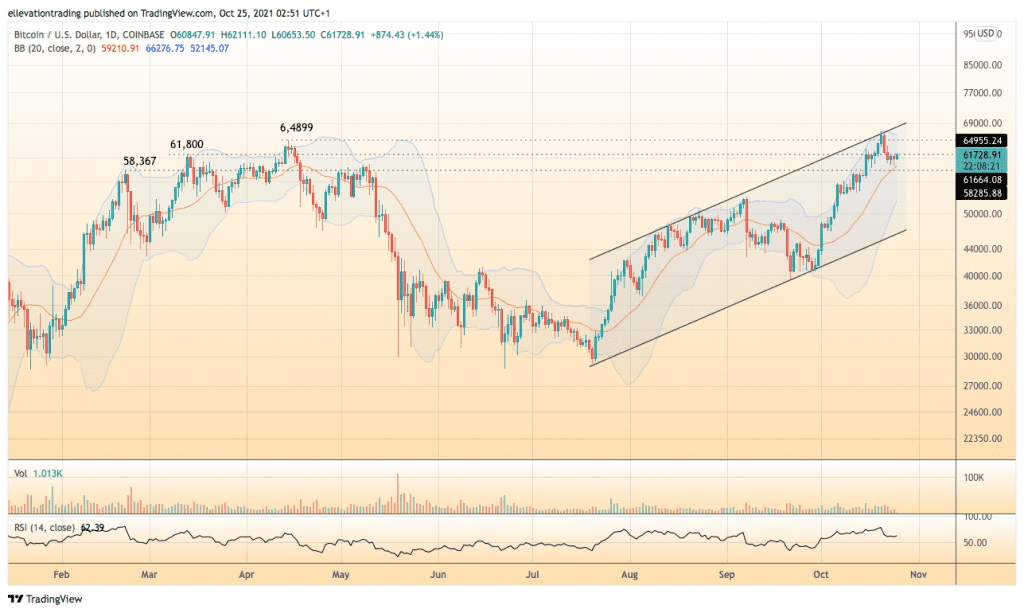
The daily chart shows that BTC has been trending higher in a parallel channel since July. During Thursday’s run to a new record, the price encountered considerable resistance at the top of the trend channel, which lined up with the upper Bollinger band at $66,800. As a result, the BItcoin price has dropped below the former all-time highs from March and April ($61,800 and $64,899). However, the price has good support at $60k, followed by the 20-day Moving Average at $59,210 and former ATH from February at $58,367.
The upside targets for the bulls are clear. First, the bitcoin price needs to climb above the ATH’s from earlier this year. The upper Bollinger band at $66,278 and the $66,999 record follow. If BTC successfully reaches a new high, it should extend to trend resistance at $68,300. Above that, bullish momentum could take the price into the $70,000-$72,000 range. However, considering the recent performance and the amount of buying ahead of the ETF launch, there is a downside risk. If Bitcoin breaks below the February ATH of $58,367, an extension towards the 7th of September high of $52,800 is likely. The lower Bollinger Band at $52,143 adds to the considerable support beneath the September high. On that basis, I expect significant buying on the approach to $52,800. Because of the substantial support and resistance wrapped around the Bitcoin price, It’s unclear which part it will take. Therefore, I remain on the sidelines until either the bulls or the bears emerge victoriously.
Bitcoin Price Chart (daily)
For more market insights, follow Elliott on Twitter.