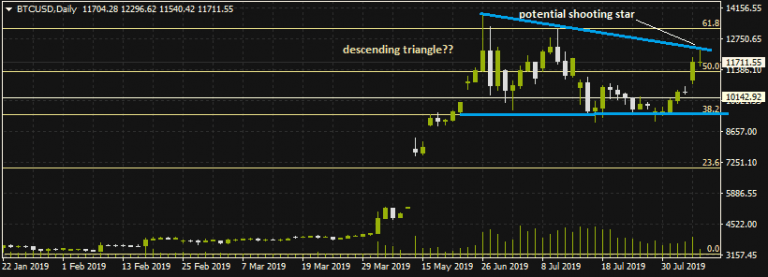
After making a 2-minute surge earlier in the trading day in a move that pushed it above the $12,000 mark, BTCUSD has faltered and is now facing the likelihood of a reversal. The daily chart shows that BTCUSD continues to obey the support and resistance levels set out by the Fibonacci retracement tracing from the swing high of November 2017 to the swing low of December 2018. Presently, BTCUSD continues to trade above the 50% retracement line at $11,701. The daily candle has the potential for forming a shooting star candlestick, which will portend a downward reversal move.
Technical Play for BTCUSD
Technically speaking, BTCUSD continues to remain in a long-term downtrend, visible on the weekly chart. If the daily candle closes at current price levels, this will complete a sequence of three successively lower highs, with previous highs seen at June 26 and July 10. The long term horizontal support formed by the 38.2% retracement line at $9,480 continues to remain intact. In other words, a descending triangle may be in the works.
If there is a descending triangle in evolution, it is expected that price will keep testing the upper and lower borders until a break is seen in the long term. If price retreats below the 50% retracement line, 10,400 and 9,480 will come into focus in the near term.Don’t miss a beat! Follow us on Telegram and Twitter.
Download our latest quarterly market outlook for our longer-term trade ideas.
Do you enjoy reading our updates? Become a member today and access all restricted content. It is free to join.