The intraday decline of the BCH/USDT pair has triggered new bearish Bitcoin Cash price predictions. This is because the decline has torn apart the support level that constituted the lower border of the descending triangle. This move paves the way for a bearish continuation of price action unless the bulls step in to defend the support at 173.2.
The scenario being witnessed on Bitcoin Cash is also playing out on Bitcoin and several altcoins, some analyzed here. The bearish continuation patterns are all signals of a weak market, dominated by bearish sentiment amid a lack of bullish fundamental triggers.
At the height of the crypto bull run in September 2021, the BCH/USDT pair was trading above $800. The latest decline now threatens to invalidate the December 2019 lows. This will result in a loss of value of more than 75% if it does happen. If the pattern plays out as expected, the March 2020 lows will come into play. Only then will traders be able to decipher if a bottom has formed or not.
Here is the Bitcoin Cash price prediction for the short term.
Bitcoin Cash Price Prediction
The active daily candle is on the verge of securing a breakdown of the triangle’s lower border at the 184.6 price mark. This move opens the door for the bears to seek a harvest point for the measured move at 149.0, where the 16 March 2020 low resides. An additional breakdown of the 173.2 support, currently being tested, is required to clear the path towards 149.0.
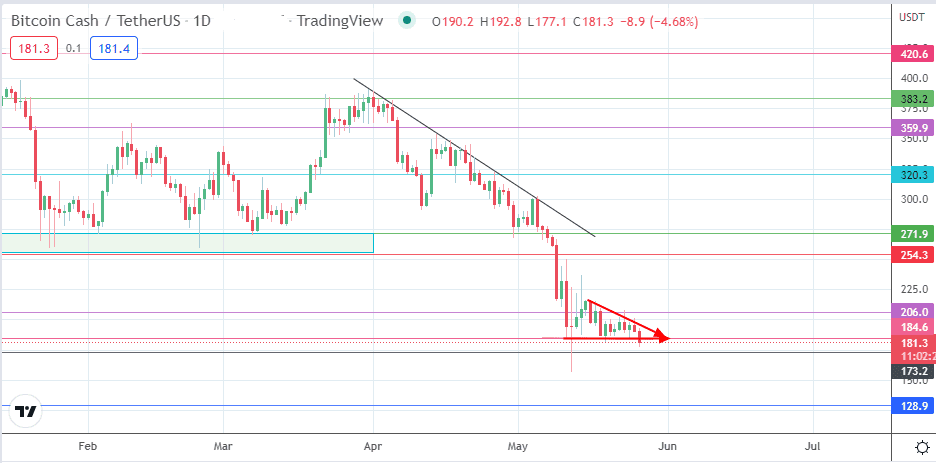
Conversely, this outlook will be negated if the bulls initiate a bounce at 173.2 that garners enough momentum to clear the 206.0 resistance (25 December 2019 low and 23 May 2022 high). This price move removes the triangle’s upper border, thus invalidating the pattern. Clearance of this resistance sets up a potential attempt at a return towards this price mark with a possible bounce that needs to take out the highs of the 12-17 May candles to reach 254.3 (26 November 2020 lows). Above this level, additional resistance barriers are found at 271.9 and 320.3, with the psychological price level at 300.0 set to form a potential pitstop.
BCH/USDT: Daily Chart