
AMC stock (NYSE: AMC) slumped to its lowest close since the 23rd of August as China’s financial market meltdown made its way stateside. AMC was not alone yesterday, and US benchmark indices started the day deeply in the red. The Dow Jones was down more than 1000 points at one stage before a late-day ramp pared the decline to 600 points.
The near-collapse of Chinese construction giant Evergrande is starting to worry markets, leading to analysts calling it china’s Lehman moment. As a result of the failure to honour its debt, Evergrande’s bonds have plummeted. Subsequently, China’s credit risk is spiking, increasing the chances of a sharp slowdown in the world’s second-largest economy. Because of this, investors have withdrawn capital from equities over the last week, at which time AMC stock has lost 24%.
Price Analysis
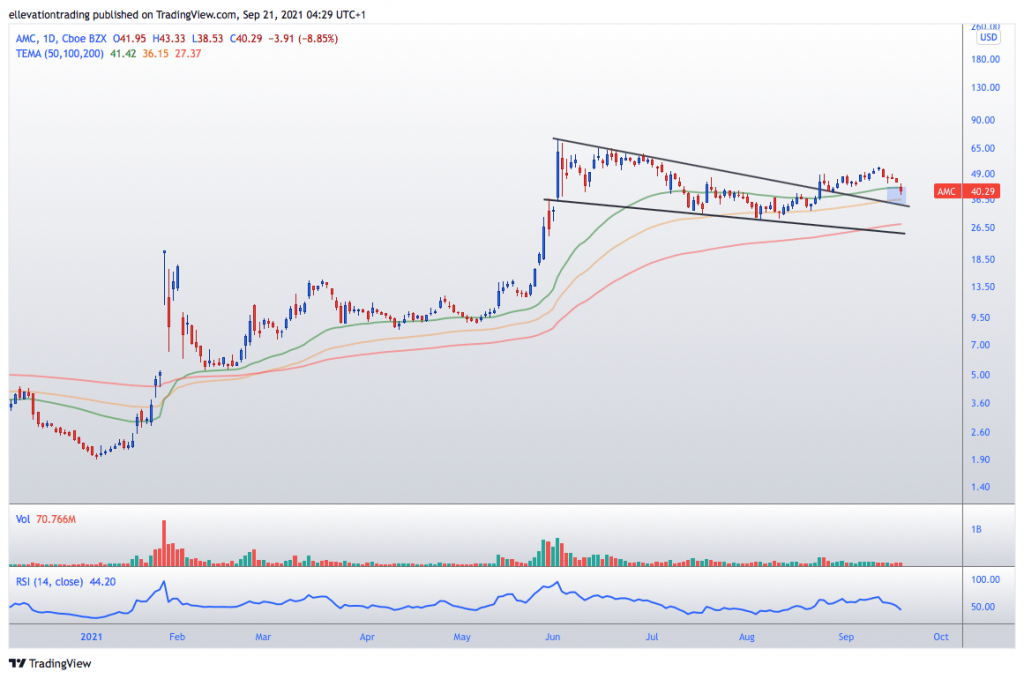
The daily chart shows that AMC had been on a good run before the correction, rallying 80% from the August low. However, after topping out at $52.79 on the 13th of September, AMC has been trading lower every day since. Furthermore, AMC stock is trading below its 50-day moving average at $41.42 and approaching the 100-day at $36.15. The 100 DMA is a significant support level, followed by trend support at $34.20. If AMC drops below the trend, a visit to the 200 DMA at $27.37 is possible.
However, if the price climbs above the 50 DMA at $41.42, it would indicate the immediate pressure has lifted. On that basis, the negative argument will carry less weight. Therefore, I will maintain a bearish bias for the stock price as long as it remains below $41.42 on a closing basis.
AMC Stock Price Chart (Daily)
For more market insights, follow Elliott on Twitter.